
Oxygen FAQ
Up to date, expert answers to frequently asked questions (FAQ) about oxygen supply systems, respiratory care and pulse oximetry written by OCC & collaborators.
Pulse Oximetry
Studies have shown that many low-cost pulse oximeters demonstrate highly inaccurate readings. However, some low-cost pulse oximeters have performed with similar accuracy to more expensive devices when used in healthy subjects. Please see our oximeter database for performance information on many low cost oximeters.
References: Lipnick et al, Anesth Analg 2016
Keywords: low-cost, low cost, cheap, inaccurate
The short answer is no. There is no such thing as a pulse oximeter simulator and none can reliably predict clinical performance for all oximeters.
There are several devices that exist to ‘simulate’ or ‘test’ pulse oximeter function including the Fluke ProSim SPOT, Fluke ProSim8 and Whaleteq AECG100.
These devices work by detecting LED pulses from an oximeter, then fabricating their own output signal to the oximeter sensor. The Fluke preserves any noise in the LED light signal while the others simply trigger from it and in doing so eliminate all potential errors due to LED noise (a very common problem with implications for oximeter performance). Some of these devices also have a limited range of simulated conditions (ie perfusion) and require prior calibration to the specific oximeter being tested. Thus, for oximeters already calibrated into the in vitro simulator, the simulator can help confirm that a device is working (or at least is sensing signal) as it was designed to do in the factory. For devices not previously calibrated, conclusions about performance are uncertain.
Multiple studies report to have used these devices to ‘validate’ oximeter performance, yet performance of an uncalibrated oximeter on an in vitro simulator does not ensure good oximeter performance in reality.
Simulators of this type are useful for determining the operating range of an oximeter. For example the limits in terms of dark skin and low perfusion can be found. One can determine if the device reads an erroneous value when pushed beyond its effective range or if it reports nothing.
The OpenOximetry.org Project is working to develop novel in vitro testing devices and protocols that overcome the limitations of prior devices. The hope is that newer techniques can better augment human study subject testing and predict device performance.
Read here for more on oximeter performance validation requirements
Some oximeters, sometimes. Blood pressure fluctuations occur with respiratory (or ventilator) cycles, and changes in the arterial waveform signal due to pulse pressure variation can often be more pronounced in hypovolemic patients. For this reason, pulse pressure variation (PPV) or pulse oximetry plethysmographic signal (POP) are sometimes used to try to assess volume responsiveness in patients.
Similar to a peripheral arterial pressure waveform, many pulse oximeters show a processed representation of the photoplethysmographic waveform. However, visual estimation of variations in the pulse oximeter waveform are unreliable. Some pulse oximeters will populate PPV or POP values that are automatically and continuously calculated based off of the waveform. However, each pulse oximeter manufacturer uses different algorithms to calculate these values and displays, making it very difficult to interpret accurately and clinically.
Some studies have stated that POP appears to be effective for predicting fluid responsiveness in ventilated patients, while others have found that it did not correlate well with arterial pressure waveforms. Overall, using pulse oximeters in isolation to evaluate volume responsiveness is not adequately validated or reliable in the clinical setting at this time. This is due to many limitations of this technique including poor or noisy signal, probe position, motion, vasoconstriction, and highly processed pleth signals which vary among manufacturers.
References: Hess, Respir Care 2016; Sandroni et al, Intensive Care Med 2012; Addison, Anesth Analg 2014; Monnet et al, Crit Care 2005; Antonsen et al, Anesthesiol Res Pract 2012
Keywords: pulse pressure variation, PPV, volume, fluid, POP
Most pulse oximeters do not need to be calibrated by the user before they will work properly. During device development, the microprocessors of pulse oximeters are calibrated using reference SaO2 measurement data that are compiled from healthy volunteers. Volunteers are typically exposed to different levels of inspired oxygen to yield SaO2 ranging from around 75 to 100%.
There are devices such as the Fluke ProSim 8 that are designed to check if select manufacturers’ oximeters are functioning, but are not designed to validate accuracy.
References: Lifebox Pulse Oximetry Learning Module
Keywords: calibration
Sickle cell disease (SCD) is a blood disorder that affects the structure of hemoglobin. It impairs the delivery of oxygen to the tissues. Due to this alteration in hemoglobin structure, patients with SCD’s oxygen dissociation curve is often shifted to the right, as shown in the figure below. This leads to lower SaO2 values for a given PaO2, particularly as patients become more hypoxemic.
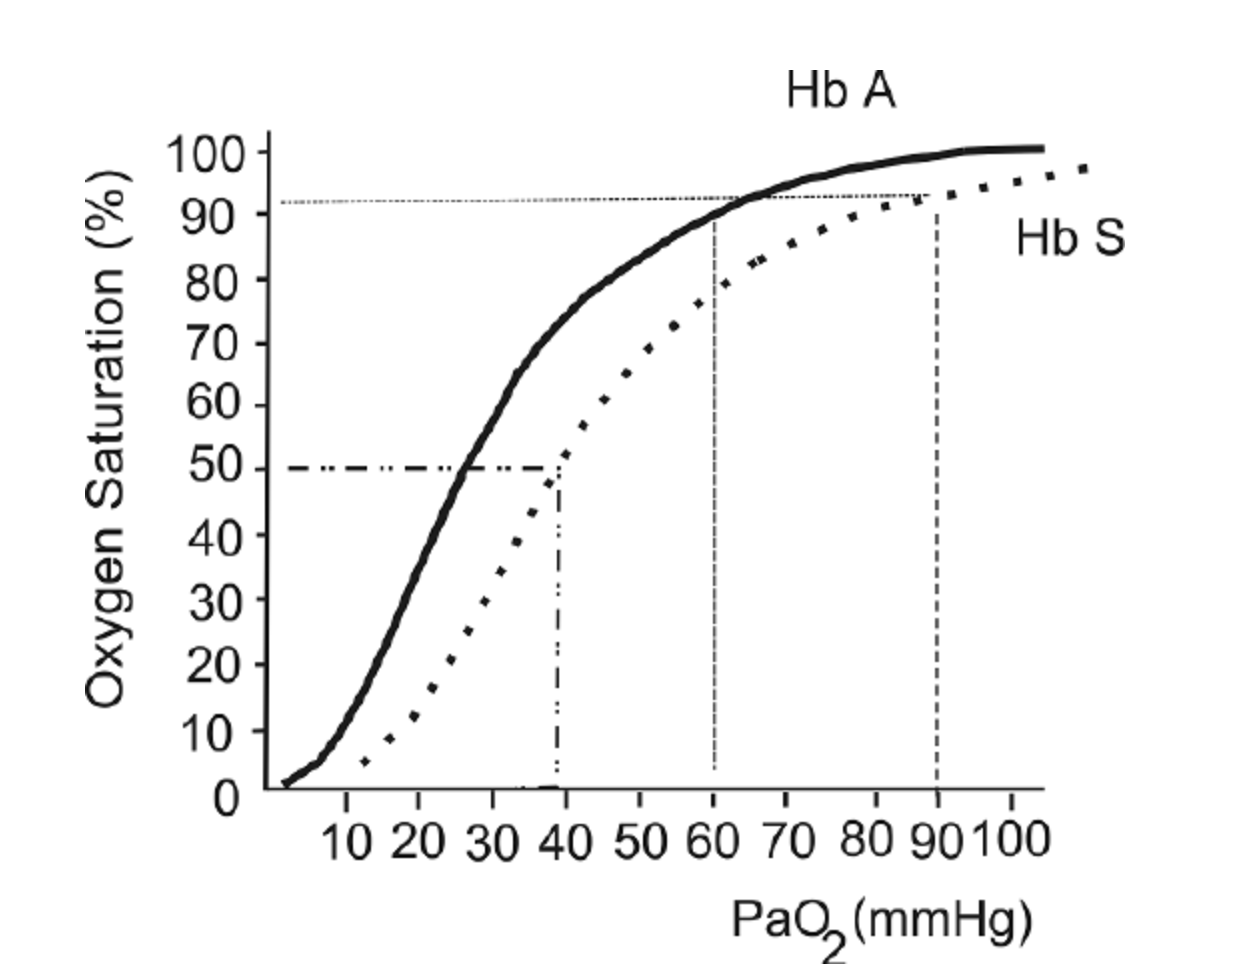
The oxygen hemoglobin dissociation curve shows the values for hemoglobin (Hb) A (solid line) and a patient with Hb S (dashed line).
This figure is taken from a Free Access paper: Wagner, M. H., & Berry, R. B. (2007). A patient with sickle cell disease and a low baseline sleeping oxygen saturation. Journal of Clinical Sleep Medicine, 3(3), 313-315.
The change in structure of hemoglobin has been thought to impact pulse oximeter accuracy. Several small studies over the last 30 years have been performed and references are listed below. These studies showed mixed results, ranging from “no clinically significant bias” (Fitzgerald et al, 2001) to a difference between SpO2 and SaO2 of more than 2% in one-quarter of study participants (Ariglani et al, 2020). In the majority of studies, SpO2 underestimated SaO2 by 1-3%.
The findings of these studies are summarized below:
F Ortiz et al. : Small study in adults with SCD in acute vaso-occlusive crisis. 22 paired SaO2 and SpO2 samples. Found a mean 1.1% underestimate of SaO2 using SpO2. Concluded that “as long as strong and regular photoplethysmographic waves are present, pulse oximeters can be relied upon not to misdiagnose either hypoxemia or normoxemia in SCD.”
Ariglani et al.: Small study in pediatric patients with SCD. Compared 39 simultaneous and paired SaO2 and SpO2 samples. SaO2 samples were taken from arterialized earlobe blood gasses. Findings: “Pulse oximetry was inaccurate in almost a quarter of measurements in ambulatory pediatric patients with SCD, especially at SpO2 values ≤93%.” “In 9/39 (23%) cases, the difference in SpO2–SaO2 was greater than the expected error range ±2%, with SaO2 more often underestimated by SpO2 (6/9), especially at SpO2 values ≤93%”
Blaisdell et al. Pediatric population with SCD. Assessing rate of missed hypoxemia (Assumes SpO2<93% equates to PaO2<70mmHg). Compared 22 pairs of SaO2 and SpO2. Mean difference of 5%, with SD of 5.3%.
Fitzgerald et al. : Evaluating accuracy of pulse oximetry via correlation with SaO2 in a pediatric population with SCD. 24 patients, total of 21 simultaneous and paired SpO2 and SaO2 samples. Findings: The pulse oximeter correlated well with the cooximeter-measured arterial saturation (r2 = .74). The pulse oximeter significantly underestimated saturation by a mean of −1.6% (95% confidence interval, −0.3 to −3;p = .03). “Pulse oximetry significantly underestimates true arterial saturation, but the bias is clinically insignificant”
Figure from: Wagner, M. H., & Berry, R. B. (2007). A patient with sickle cell disease and a low baseline sleeping oxygen saturation. Journal of Clinical Sleep Medicine, 3(3), 313-315.
References:
Ortiz, F. O., Aldrich, T. K., Nagel, R. L., & Benjamin, L. J. (1999). Accuracy of pulse oximetry in sickle cell disease. American journal of respiratory and critical care medicine, 159(2), 447-451.
Arigliani, M., Zheng, S., Ruiz, G., Chakravorty, S., Bossley, C. J., Rees, D., & Gupta, A. (2020). Comparison of pulse oximetry and earlobe blood gas with CO-oximetry in children with sickle cell disease: a retrospective review. BMJ Paediatrics Open, 4(1).
Blaisdell, C. J., Goodman, S., Clark, K., Casella, J. F., & Loughlin, G. M. (2000). Pulse oximetry is a poor predictor of hypoxemia in stable children with sickle cell disease. Archives of pediatrics & adolescent medicine, 154(9), 900-903.
FitzGerald, R. K., & Johnson, A. (2001). Pulse oximetry in sickle cell anemia. Critical care medicine, 29(9), 1803-1806.
Keywords: sickle cell disease, HbS
Anecdotal observations have suggested potential oximeter inaccuracy when readings are obtained through tattoos or henna. Many manufacturers warn this can be a cause of inaccuracy. Controlled studies are lacking to characterize this effect, and performance may vary by oximeter.
References: Zolfaghari et al, Emerg Med J 2015; Battito, Anesth Analg 1989
Keywords: ink, tattoo, henna, fingerprint
There are limited data on the effect of severe anemia (hgb <7 g/dL) on pulse oximeter accuracy, and this is still an active area of research. Some studies have suggested that severe anemia may affect pulse oximeter readings. They have shown that in hypoxemic patients (SaO2 is below 80%) with very low hemoglobin concentrations, SpO2 may give falsely low readings and underestimate the real SaO2. However, for normoxic patients, anemia appears to have less of an effect on SpO2 measurements.
Another study has reported that in the setting of acute hemorrhage, pulse oximeters remain accurate even down to a hemoglobin of 2.3 g/dL in patients with SaO2 of >93% (normoxic).
However, there is still a need for further data to better understand how severe anemia affects oximetry accuracy, especially during concurrent significant hypoxemia. This is an active area of research for the UCSF Hypoxia Lab and OpenOximetry.org.
Severe anemia and concurrent hypoxemia are more common than you might think. Using the example of malaria, one of many common causes of anemia worldwide, severe malarial anemia (Hgb <5 g/dL), accounts for nearly 1 million childhood deaths in sub-Saharan Africa (SSA) each year (18% of all childhood deaths in SSA). The prevalence of severe anemia (Hgb <7 g/dL) from any cause has been reported in nearly 1 in 10 children in SSA.
References: Severinghaus et al, Anesthesiology 1992; Jay et al, Ann Emerg Med 1994; Severinghaus et al, J Clin Monit 1990; Chan et al, Respir Med 2013
Keywords: anemia, low hemoglobin
Elevated bilirubin has been reported by some studies to potentially underestimate oxygen saturation by pulse oximetry, though most available data have not shown any effect on the accuracy of Spo2 with bilirubin levels up to 84.3 mg/dlitre. The light absorption spectrum of bilirubin has a broad peak at 460 nm and two smaller peaks at 560 nm and 600 nm. Based on this, bilirubin is relatively unlikely to have a detectable effect on the absorption of the 660 nm and 940 nm wavelengths commonly used by pulse oximeters.
References:
https://pubmed.ncbi.nlm.nih.gov/2024749/
https://pubs.asahq.org/anesthesiology/article/70/1/118/30895/Hyperbilirubinemia-Does-Not-Interfere-with
https://pubmed.ncbi.nlm.nih.gov/2967958/
Cooler body temperatures can affect pulse oximeter accuracy. This is because cold extremities can lead to vasoconstriction and poor perfusion, which makes it difficult for the probe to detect a good pulse signal. Warming the body part where the probe is placed can be helpful in some cases.
References: Lifebox Pulse Oximetry Learning Module
Keywords: temperature, vasoconstriction, cold
There have been a few studies that have evaluated the effects of henna on pulse oximetry results. Most of these studies were conducted on normoxic patients (i.e. healthy patients with normal oxygen levels) and found that the SpO2 values from patient fingers with henna dye were not significantly different from values obtained on non-dyed fingers. One study showed that pulse oximeter saturations from henna dyed fingers were significantly higher in patients who were hypoxemic. This means that in the setting of hypoxemia, pulse oximeters placed on body parts with henna dye may show falsely high SpO2 readings. Another study looked at red and black henna in healthy adults and found that red henna had no effect on pulse oximeter reading, but the black henna caused difficulty in obtaining a SpO2 reading. Given these findings, it may be best to choose a finger that does not have henna dye for placement of the pulse oximeter.
References: Çiçek et al, Emerg Med J 2011; Samman et al, Saudi Med J 2006; al-Majed et al, Trop Geogr Med 1994
Keywords: henna, henna dye, henna paste
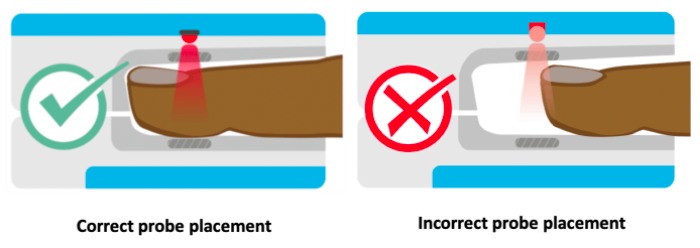
Ideally, it is best to place the probe on a warm finger on the patient’s non-dominant hand so that the patient can still use their dominant hand without hindrance. For patients with decreased levels of consciousness (e.g. emerging from sedation), the middle finger is a good finger to place the probe because patients are less likely to scratch their face or eyes with this finger. However, if you are unable to get a good reading on this finger, try the other fingers or the other hand until a good waveform is obtained.
References: Lifebox Pulse Oximetry Learning Module
Keywords: finger, placement, location
Poor oximeter performance (i.e. either inaccurate or absence of a reading) during low perfusion is a known phenomenon in clinical and laboratory settings. If a patient is cold or has peripheral vasoconstriction and poor perfusion, the pulse oximeter may have difficulty detecting a good pulse signal on the fingertip. This affects some oximeters more than others. Some oximeters perform wandering readings while others may produce steady but inaccurate results. At present, there is no requirement by certifying bodies to test oximeter accuracy under controlled or standardized conditions of low perfusion. Nonetheless, some manufacturers and labs do this testing routinely. The OpenOximetry.org Project is working to publish these data in our database while developing and advocating for standards for performance during low perfusion.
References: Lifebox Pulse Oximetry Learning Module
Keywords: vasoconstriction, poor perfusion, cold
Motion such as patient shivering, tremor, or other movements may affect the probe’s ability to detect an accurate signal. It may give an erroneous value if there is too much motion or prevent the device from obtaining a reading at all. At present, there is no requirement by certifying bodies to test oximeter accuracy under controlled or standardized conditions of motion. Nonetheless, some manufacturers and labs do this testing routinely. The OpenOximetry.org Project is working to publish these data in our database while developing and advocating for standards for performance during motion.
References: Lifebox Pulse Oximetry Learning Module
Keywords: tremor, shiver, movement, motion
Nail polish or nail varnish can impact pulse oximeter accuracy, so it is best to remove the polish to allow the light from the probe to pass through the tissue. If it cannot be removed, placing the probe on the toe or on the fingertip sideways can be an option.
Certain colors of nail polish may lead to underestimation of SaO2 by pulse oximetry. Studies have shown that in healthy adults, blue, green, black, purple and brown nail polish appear to interfere the most with pulse oximeter SpO2 readings. In fact, they can cause readings of up to a 3-5% underestimation in oxygen saturation, though data are mixed.
Another study, which examined different nail polish colors on 50 critically ill patients, showed that all colors interfered with pulse oximetry readings, but that the most significant interference was due to black, purple, and dark blue polish. All other nail polish colors had a lesser effect on pulse oximeter readings.
Regarding gel nail polish, a study in 17 healthy adults tested several colors of gel-based manicure, and concluded that certain colors of gel polish resulted in a significant overestimation of SpO2, although their results varied when using different brands of pulse oximeter.
A recent review on the topic was published in 2023 and concluded only marginal reductions on SpO2.
References: Lifebox Pulse Oximetry Learning Module, Ralston et al, Anaesthesia 1991; Adler et al, Acad Emerg Med 1998; Hinkelbein et al, Resuscitation 2007; Yönt et al, Intensive Crit Care Nurs 2014; Coté et al, Anesth Analg 1988; Yek et al, Singapore Med J 2019 Aggarawal et al, Respiratory Care, 2023.
Keywords: nail polish, varnish, nail color
The effect of skin pigmentation on pulse oximeter accuracy remains poorly characterized. Pulse oximeters may be less accurate in patients with darker skin, especially at lower oxygen saturations. Of note, this inaccuracy can tend to overestimate oxygen saturation, which may lead to false reassurance during clinically real hypoxemia. The amount of inaccuracy varies significantly between different devices, manufacturers, and probes. The OpenOximetry.org Project is actively working to better understand the impact of pigment on oximeter accuracy and to develop new strategies to eliminate this source of error.
References: Okunlola et al, Resp Care, Nov 2021, Bickler et al, Anesthesiology 2005; Feiner et al, Anesth Analg 2007; Adler et al, Acad Emerg Med 1998; Bothma et al, S Afr Med J 1996; Zeballos et al, Am Rev Respir Dis 1991; Ries et al, Chest 1989; Emery J Perinatol 1987; Sjoding et al, N Engl J Med 2020
Keywords: skin, pigment, skin tone, accuracy
For oximeters that have been approved by the US FDA, accuracy over the SpO2 range of 70-100% is within a few SpO2 percent of the actual value when tested under laboratory validation conditions (for some oximeters, performance may be different when used in various clinical conditions). Most oximeters tend to be more accurate with higher SpO2 values than lower SpO2 values.
The FDA has published guidelines for the recommended standards for pulse oximeter performance, which includes device accuracy. These guidelines require the devices to be tested with a minimum of 200 data points over an SaO2 range of 70% to 100%, and to be tested on people with different skin tones. Studies have shown that many low-cost pulse oximeters demonstrate highly inaccurate readings. However, some low-cost pulse oximeters have performed with similar accuracy to more expensive units when used in healthy subjects. However, it is important to recognize that many additional variables can make even good pulse oximeters have less accurate readings.
References: Lifebox Pulse Oximetry Learning Module; FDA Guidelines; Lipnick et al, Anesth Analg 2016
Keywords: accuracy, low-cost, guidelines, FDA
- Pulse oximetry and the Kigali Modification of the Berlin Criteria can be used to diagnose ARDS (Riviello et al, Am J Respir Crit Care, 2016)
- See Kigali Criteria summary on the Respiratory Care Pocket Card
- In the absence of ABGs, management of ARDS is extremely challenging. While SpO2 provides information for most patients, there are limited surrogates for assessing ventilation or acid base status, both key diagnostic information for ARDS management
- This calculator can be used to estimate P:F ratios when only SpO2 values are available
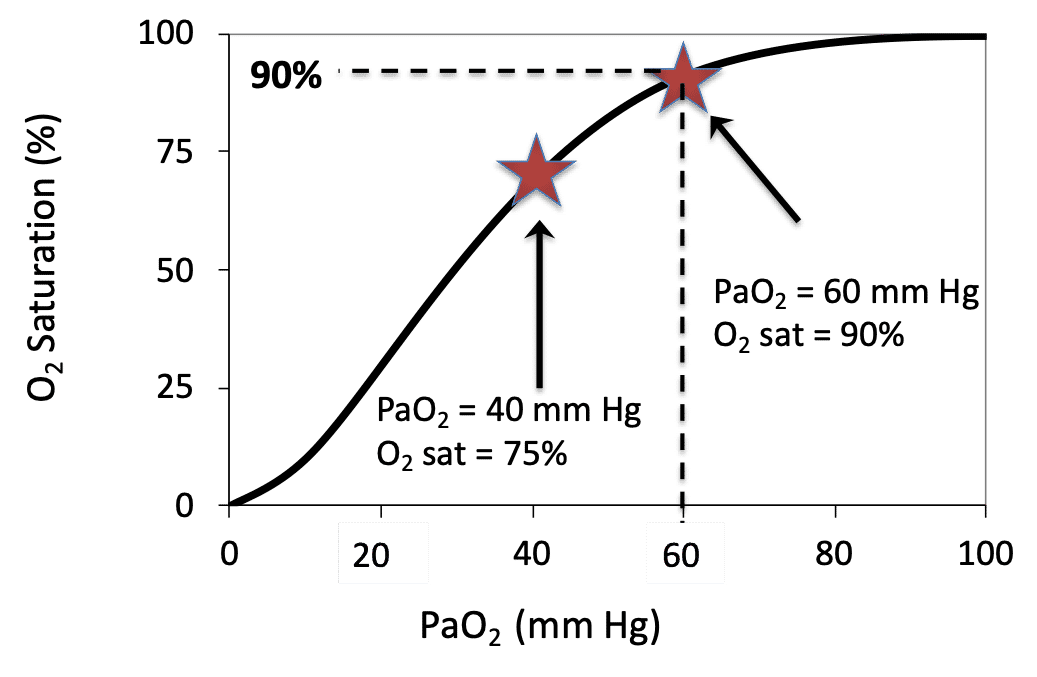
PaO2 is a measurement of the partial pressure of oxygen in arterial blood and requires an arterial blood gas (ABG). In many settings an ABG may not be practical or feasible, and thus the established mathematical relationship between SpO2 and PaO2 can be used. There is a distinct relationship between PaO2 and SpO2 which is illustrated by the Oxygen Dissociation Curve (see image). This relationship can be altered by many factors (e.g. temperature, FDG, pH) but generally follows the classic “S-shape” graph with PaO2 on the x axis and oxygen saturation on the y axis. This online calculator can be used to convert SpO2 to PaO2.
References: Lifebox Pulse Oximetry Learning Module; Oxygen Calculator Website
Keywords: PaO2, oxygen dissociation curve, conversion
Different models of pulse oximeters will look slightly different and may have some variation, but many devices will operate in a similar way. The screen of the device will show a reading of the SpO2, the pulse rate, and often the waveform.
- If possible, first remove any nail polish and warm the hands if they are cold.
- Ensure that the probe is connected to the oximeter and that the device is charged.
- Power on the device, and then clip the probe onto the fingertip while keeping the patient’s hand still.
- After a few moments, the screen will display the SpO2.
- If the device shows a pleth, it is important to check that the waveform looks appropriate.
Many pulse oximeters also have buttons which allow the user to control alarm volume, screen display, and turn the device on and off. Now, the patient can continue to be monitored and checked for signs and symptoms of hypoxemia. It is always important to follow the manufacturer’s instructions for use if these are available. Finally, if the device does not seem to be working, try to troubleshoot the issue.
References: Lifebox Pulse Oximetry Learning Module
Keywords: how to use, instructions
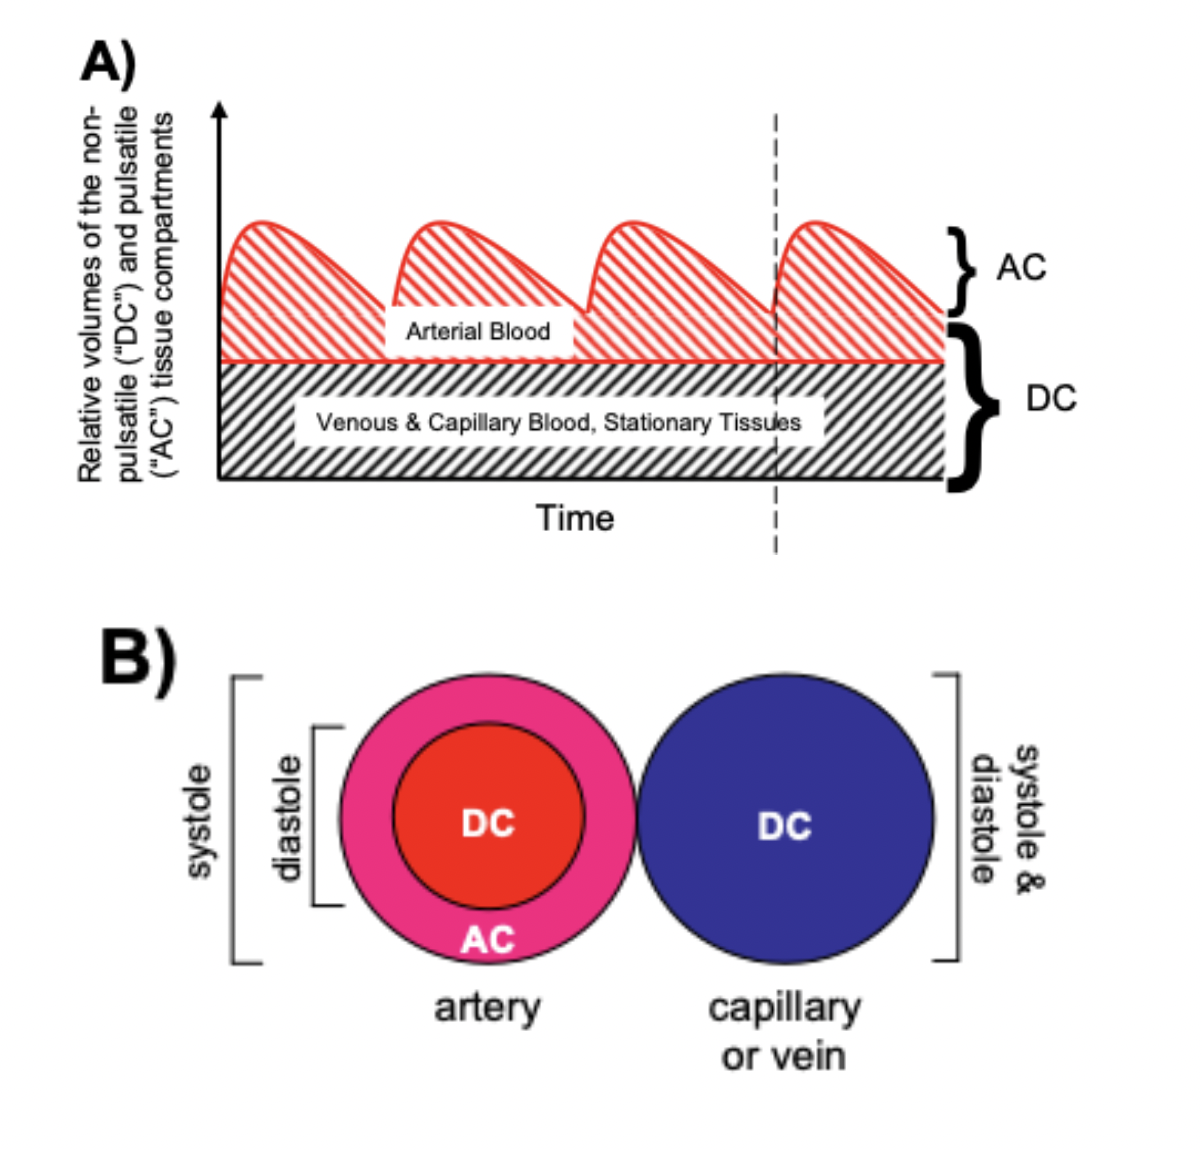
Pulse oximeters estimate the SpO2 of arterial blood, isolated from other tissues (including venous blood), by applying the Beer-Lambert Law as arterial blood volume fluctuates throughout the cardiac cycle. The Beer-Lambert Law of absorbance demonstrates that the transmission of light is attenuated as it passes through different optical filters (tissue types). Oxygenated hemoglobin and deoxygenated hemoglobin have unique molar extinction coefficients for different wavelengths of light. As arterial blood volume increases during systole the amount of oxygenated hemoglobin increases and ratio of red to infrared light changes (known as the modulation ratio).
Conversely, the blood volume and therefore the amount of oxygenated hemoglobin changes very little throughout the cardiac cycle in other tissue types. By taking the amount of change in absorbance over the change in time (pulse rate), the non-arterial tissues are effectively eliminated mathematically (see below) and the amount of oxygenated hemoglobin in arterial blood remains.
Mathematically (for transmittance pulse oximeters):
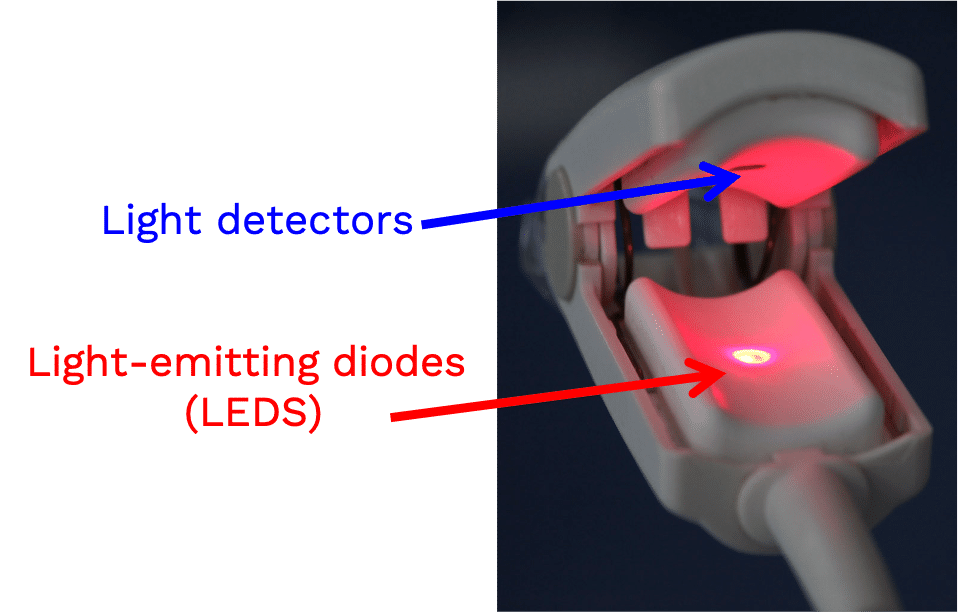
Light from the light-emitting diode is absorbed as it passes through various tissue types before being measured by the photodiode detector.
Absorbance(total) = sum(Absorbance(all tissue types)) Formula 1
Absorbance(total) = Absorbance(arterial blood) + Absorbance(venous blood) + Absorbance(skin, varies by pigment type or melanin content) + Absorbance( other tissue types fat, bone, vessel walls, etc) Formula 1a
Taking the derivative, or measuring the change in Absorbance(total) over the change in time gives the following:
dAbsorbance(total)/dt = dsum(Absorbance(all tissue types))/dt Formula 2
dAbsorbance(total)/dt = dAbsorbance(arterial blood)/dt + dAbsorbance(venous blood)/dt + dAbsorbance(skin)/dt + dAbsorbance(other tissue types)/dt Formula 2a
As dAbsorbance for non arterial tissue types is essentially zero throughout the cardiac cycle, dAbsorbance(total)/dt reduces to:
dAbsorbance(total)/dt = dAbsorbance(arterial blood)/dt Formula 3
Absorbance = the negative log of transmission, and Formula 3 can be written as:
R = [dlog(transmission)/dt]wavelength1/[dlog(transmission)/dt]wavelength2 Formula 4
(R = Modulation Ratio, wavelength 1 and 2 are wavelengths of red light and infrared light)
or alternatively, as:
R = (AC/DC)wavelength1/(AC/DC)wavelength2 Formula 5
(AC = alternating component and DC = constant(direct) component)
Without an adequate pulse, pulse oximeters will either be unable to measure SpO2 or will report inaccurate SpO2 levels.
References: Chan et al, Respiratory Medicine 2013 Mannheimer Anesth Analg. 2007
Keywords: modulation, ratio
A transmittance pulse oximeter contains two small light-emitting diodes (LED) which each emit a specific wavelength of light, 660 nm (red) and 940 nm (near infrared). Oxygenated Hemoglobin (O2Hb), absorbs a greater amount of 940 nm wavelength light and a lower amount of 660 nm wavelength light than does deoxygenated hemoglobin (HHb). Opposite from the LED, a transmittance pulse oximeter utilizes a photodiode to measure the amount of 940 nm and 660 nm wavelength light that is transmitted through the body part between the LED and photodiode. A microprocessor then calculates SpO2 using the ratio of the measured absorbances over a series of pulses based on individual device calibration to determine the modulation ratio and its corresponding SpO2.
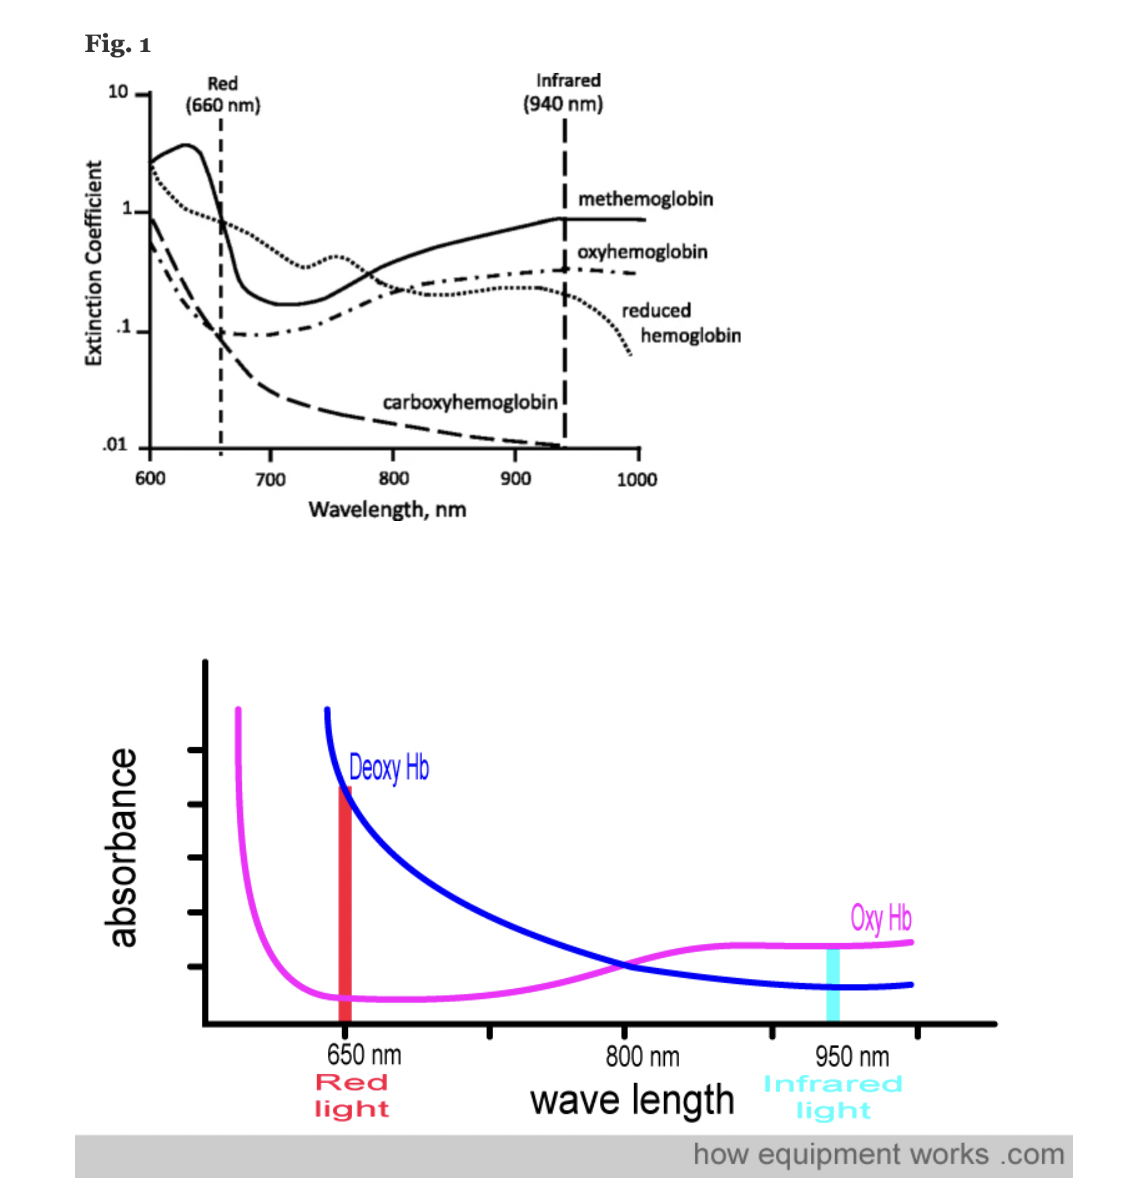
Figure: Jubran, Critical Care, 2015
References: Chan et al, Respiratory Medicine 2013 Lifebox Pulse Oximetry Learning Module; WHO Using Pulse Oximeters Jubran, Critical Care, 2015 How Equipment Works – Pulse Oximeter
Keywords: wavelengths, IR, infrared, red, LED, photodiode, hemoglobin
A pulse oximeter is a noninvasive monitoring device that can indirectly measure a person’s functional oxygen saturation (SpO2) and help with early detection of hypoxemia. Pulse oximeters work by either transmitting light through tissue perfused by blood (ideally a site with a dense capillary bed like the fingertip). They are called pulse oximeters because they use the pulsations to discriminate between arterial blood and other tissue or venous blood. The probe on the pulse oximeter has light-emitting diodes (LEDs) which shine at least two types of light, red and infrared. The device is positioned so that the light shines through a translucent part of a patient’s body, such as a fingertip or earlobe, and measures the changing absorbance at each wavelength. Oxygenated hemoglobin absorbs more infrared light, whereas deoxygenated hemoglobin absorbs more red light. Since the absorption of light at these wavelengths differs between oxygenated and deoxygenated blood, the device can determine the absorbances due to just the arterial blood and thereby determine a patient’s peripheral oxygen saturation.
References: Lifebox Pulse Oximetry Learning Module; WHO Using Pulse Oximeters
Keywords: wavelengths, IR, infrared, red, LED
For FDA or ISO clearance, pulse oximeters must undergo testing in healthy human study subjects.
ISO 80601-2-61 defines the test requirements, and the FDA has published guidance that refers to this standard. The standard requires the devices to be tested with a minimum of 200 data points (paired observations: pulse oximeter, co-oximeter) evenly distributed over an SaO2 range of 70% to 100%. The standard requires that devices be tested on “10 or more healthy subjects that vary in age and gender” and that the study has subjects with “a range of skin pigmentations, including at least 2 darkly pigmented subjects or 15% of the subject pool, whichever is larger.”
Briefly, study subjects are semi-supine (30° head up) with a nose clip (to prevent breathing through the nose), breathing controlled mixtures of air-nitrogen-carbon dioxide via a mouthpiece from a partial rebreathing circuit with a voluntarily increased minute ventilation (sometimes coached with a metronome) and 10 to 20 L/min total fresh gas flow into the circuit. A 22-g radial artery catheter is placed to sample arterial blood for the measurement of SaO2.
The gas mixture (e.g. nitrogen) of the circuit is manually adjusted to achieve a series of 10 to 12 stable SaO2 plateaus between 70% and 100% (approximately 70%, 73%, 76%, 80%, 83%, 86%, 89%, 92%, 95%, 98%, and 100%). Carbon dioxide is manually increased into the circuit to prevent hypocapnia. At each plateau (after 30-60 seconds of stability) an arterial sample is drawn and immediately “functional” arterial Sao2 (HbO2/[Hb+HbO2]) is determined by multi-wavelength oximetry (e.g. an ABL-90, OSM3 or similar device). After an additional 30 seconds of stability another sample is drawn. These SaO2 values are recorded and used to compare with recorded simultaneous SpO2 values from the device being tested. During the tests, subjects’ extremities may be placed under a warmer to promote good perfusion.
References: FDA Guidelines
Keywords: FDA, guideline, clinical, accuracy, 510k, approval, ISO
The short answer is that there is no standardized approach.
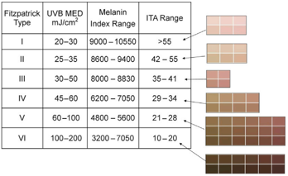
According to FDA regulations, manufacturers of pulse oximeters should validate device performance on “a range of skin pigmentations, including at least 2 darkly pigmented subjects or 15% of the subject pool, whichever is larger.” While ‘darkly pigmented’ is not formally defined, it is routinely defined by testing labs as Fitzpatrick skin phototype groups V-VI. The Fitzpatrick scale is a widely used method for classifying skin pigment, from I (pale white) to VI (darkest brown). However, it was originally developed for skin photosensitivity typing, which is not the same as skin color, and should not be conflated with race or ethnicity. Studies have shown inaccuracies in self-reported values, especially in darker skin types. There are other similar visual skin color classification systems, but as with the Fitzpatrick scale, they are all subjective.
In early 2021, in response to Sjoding et al’s findings of racial (note, not necessarily skin color) bias in pulse oximetry measurement, the FDA issued a statement encouraging further investigation on pulse oximeter accuracy in darker skin types. Given the limitations of the Fitzpatrick scale, there is a need to adopt a standardized objective method for measuring skin color that provides reliable, quantitative, and easily interpretable results. For more discussion on new ways to address racial inequity in oximetry, check out this paper (November 2021).
There are several commonly used methods for determining ‘skin color.’ Not all are used for the purposes of pulse oximeter validation cohort diversity. Below we discuss some of these methods including information on a few commonly encountered colorimeters on the market, including Mexameter, Colorimeter, and DermaCatch.
Below is a table summarizing several traditional classification systems for assessing skin color (not quantitative):
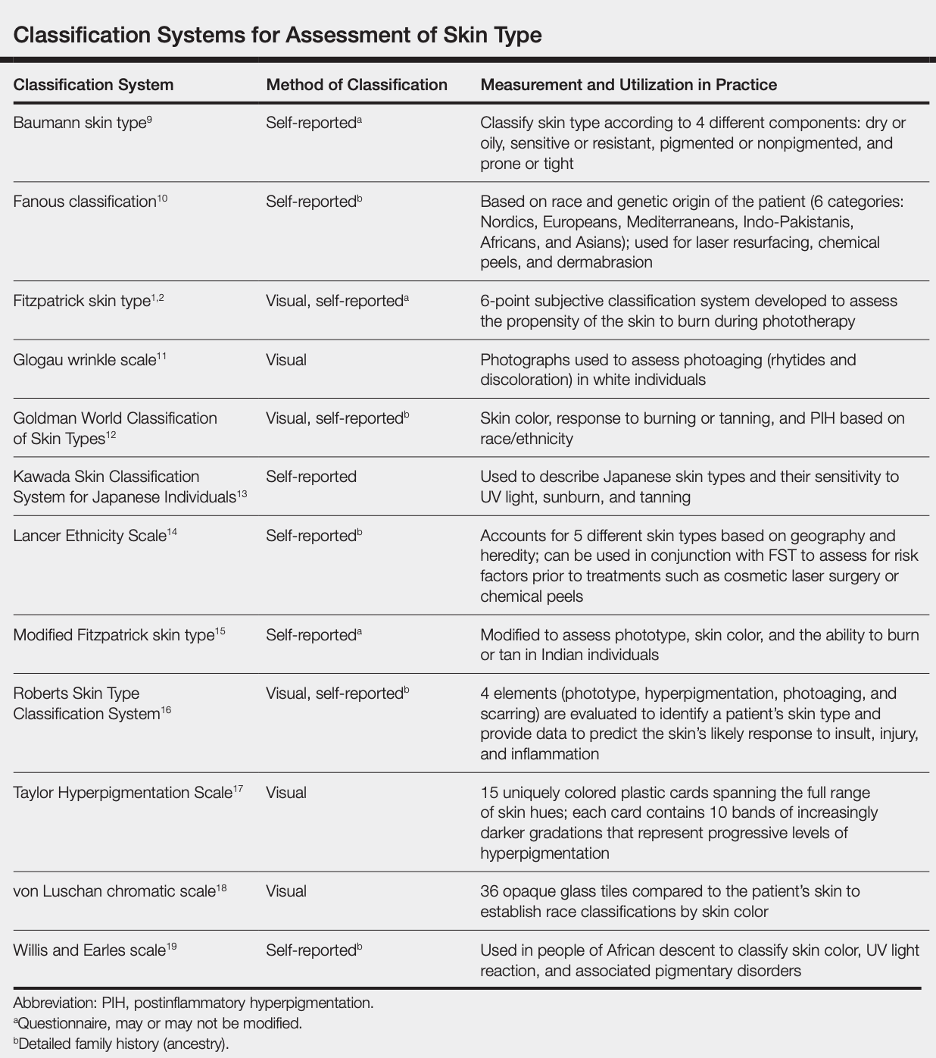
Reference: Ware et al, Racial Limitations of Fitzpatrick skin type, Cutis, 2020
Fitzpatrick Scale
The Fitzpatrick skin type (FST) was developed in 1975 as a tool to assess the likelihood to burn during phototherapy treatments and is commonly used. The original scale was I-IV and it was only later that more diverse skin types were included.
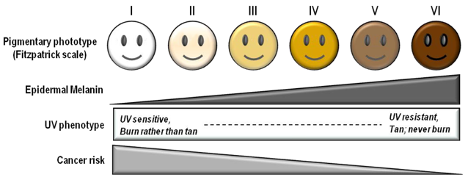
References: Image: CC BY 3.0 – D’Orazio et al, Int J Mol Sci, 2013; Eilers et al, Accuracy of Self-Report in assessing Fitzpatrick skin phototypes, JAMA Derm, 2013 ; Ware et al, Racial Limitations of Fitzpatrick skin type, Cutis, 2020 ; Wong et al, Analysis of discrepancies between pulse oximetry and arterial oxygen saturation measurements by race and ethnicity and association with organ dysfunction and mortality, JAMA, 2021
Von Luschan’s Chromatic Scale
The Von Luschan’s Scale was developed as a tool to assess racial classifications according to skin color. It consists of 36 colored tiles which are compared to a person’s skin color.
This image is a reproduction of the Von Luschan scale which was originally created by Felix von Luschan and printed in Voelker, Rassen, Sprachen (1927). The original chart was scanned and the skin colors were copied using the paint program’s dropper tool.
Our team at Open Oximetry calculated the RBG values which are superimposed on the image of the scale. Notably, 13 and 14 were found to have the same RGB values.
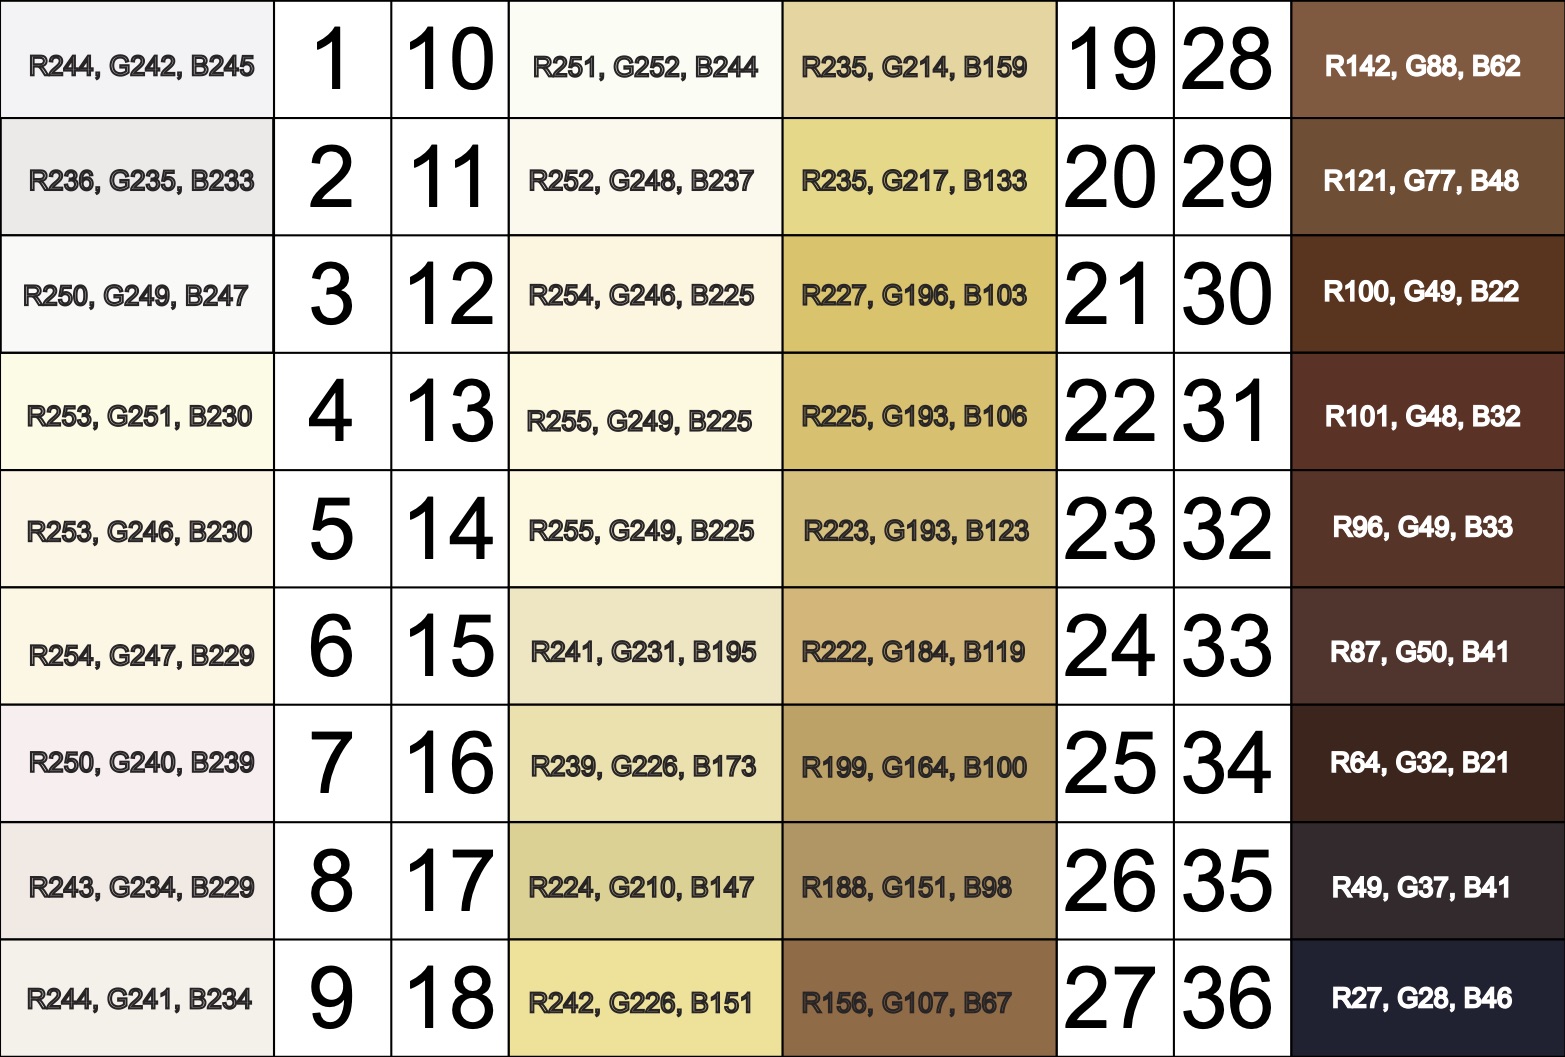
References: Wikimedia Von Luschan’s Scale
Other ways to quantify skin pigment
Below we describe a few (of the many) products on the market to quantify skin pigmentation.
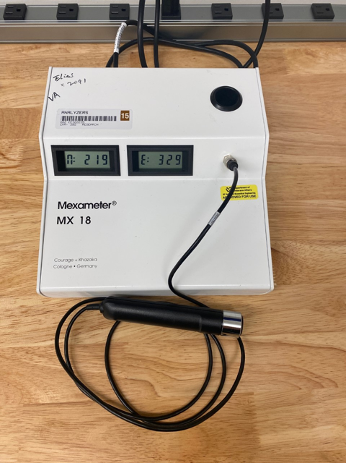
Mexameter® (MX 18) by Courage & Khazaka
- Narrow-band reflectance colorimeter (only targets melanin and hemoglobin)
- Output: melanin index and erythema index (arbitrary units 0-999)
- Melanin index can be falsely affected by erythema
- Requires base to be plugged in to display results (no computer needed)
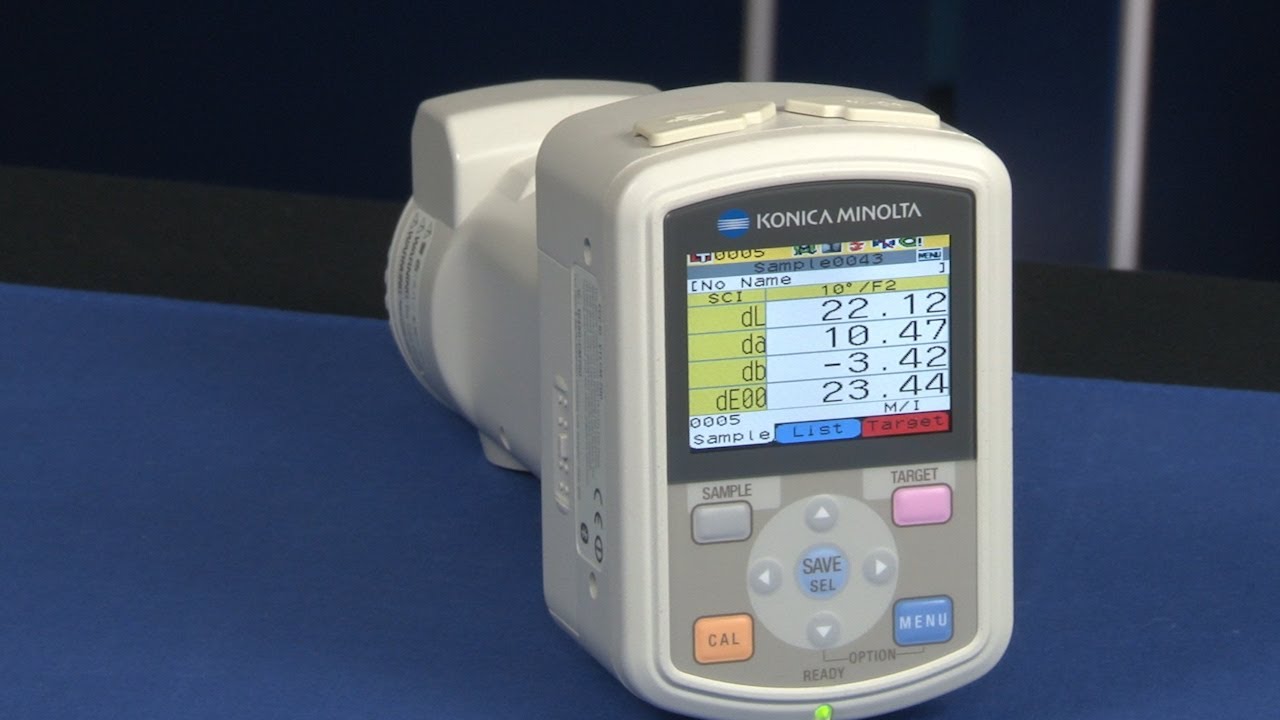
- The CM-700d Spectrophotometer is portable, wireless, and lightweight
- Allows for evaluation, reproduction, and control of pigment colors
- Aperture switches between 3mm and 8mm sizes to evaluate small to large samples
- Color spaces: L*a*b*, L*C*h, Hunter Lab, Yxy, XYZ, Munsell
For more information on studies conducted with the CM-700d Spectrophotometer, please view the following: 2022 study, 2020 study, and 2017 study.
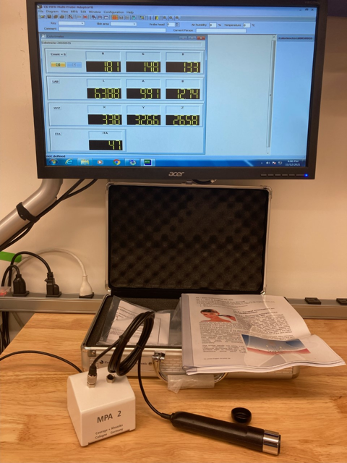
Colorimeter® (CL 400) by Courage & Khazaka
- Full visible spectrum reflectance colorimeter
- Output: skin color RGB, L*a*b, xyz, ITA
- Requires USB connection to Windows PC to display results
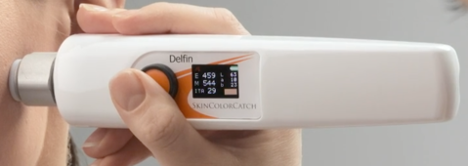
SkinColorCatch® (previously DermaCatch) by Delfin Technologies
- Full visible spectrum reflectance colorimeter
- Output: skin color L*a*b, ITA, L*c*h, RGB, melanin and erythema indices
- Melanin and erythema indices insensitive to each other
- Portable and battery operated
Other Skin pigment scales:
The color bar tool was developed by dermatologists to determine the amount of melanin pigment in various skin types and assess an individual’s potential to get a sunburn. This was done by comparing the color tool against the sun protected skin of the upper inner arm, and is best used when people are not flushed from exercise or heat to avoid any excess redness that might distort the visual perception of color.

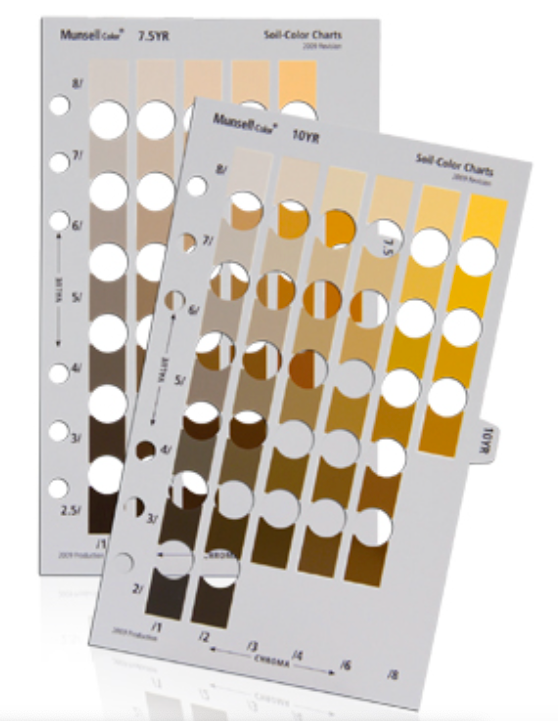
The Munsell color chart (also known as the Munsell system of color notation) was created to specify an objective assessment of color based on three properties of color: hue, value, and chroma. Hue refers to the basic color which is described as red (R), yellow (Y), green (G), blue (B), and purple (P) across a range of values. Value refers to the lightness or darkness of a color, which ranges from 10 (pure white) to 0 (pure black). Chroma describes the color intensity, which ranges from light pastel colors to deeply saturated colors. The Munsell chart was originally designed as the official color system for soil colors and to be used in agriculture, but has been adopted for use to describe and assess human skin tones. Multiple sets of color tiles are available for purchase and can be compared against an individual’s skin to determine the closest color match.
Various studies have used the Munsell system for skin color assessment. Many are related to dermatologic treatments and use the Munsell chart to describe the colors of capillary vascular malformations, melasma, hyperpigmentation, and other skin discolorations. The most common Munsell color charts used to determine skin pigments were the 5YR and 7.5YR, though 2.5YR and 10YR were also frequently used.
References: Reeder et al, CEBP, 2014, Wright et al, Skin Research & Technology, 2015, Ries et al, CHEST, 1989, Foglia et al, J Pediatr, 2017, Konishi et al, J Dermatol, 2007, Wright et al, Skin Res Technol, 2016, McCreath et al, J Adv Nurs, 2016
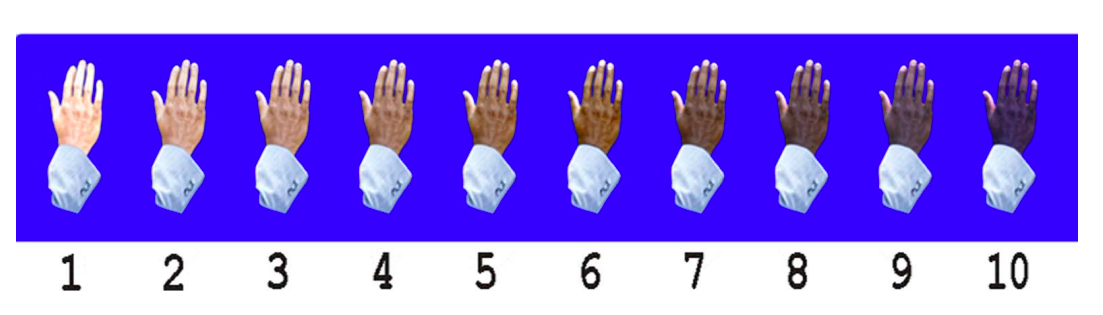
The Massey-Martin Scale (also known as the New Immigrant Survey or NIS Skin Color Scale) is an 11-point scale, ranging from zero to 10, which was created to assess skin color. Zero represents albinism, or the absence of color, and 10 represents the darkest possible skin tone. The shades of skin color from 1 to 10 are depicted on the scale as a hand which differs in color for each number. The Massey-Martin scale has been used in various publications, especially topics related to skin color and the economic mobility of immigrants. The scale is intended to be essentially memorized by interviewers so that they can determine respondent’s skin tone without the respondent seeing the chart.
References: Hannon et al, Public Opin Q, 2016, Babool et al, Rheumatology, 2022, Massey NIS Skin Color Scale, 2003
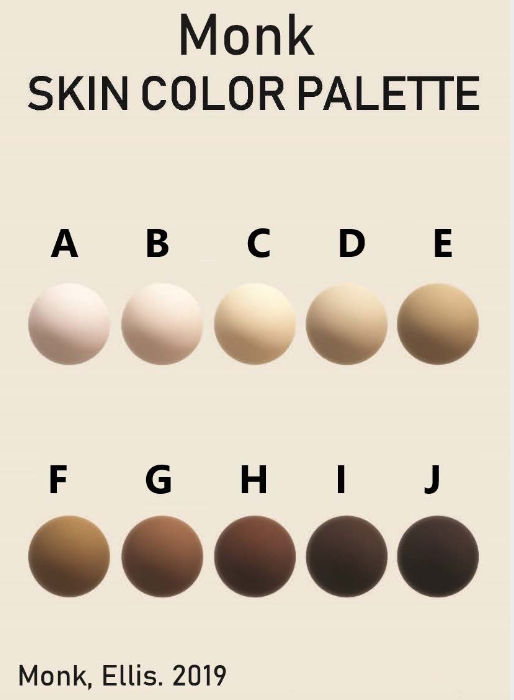
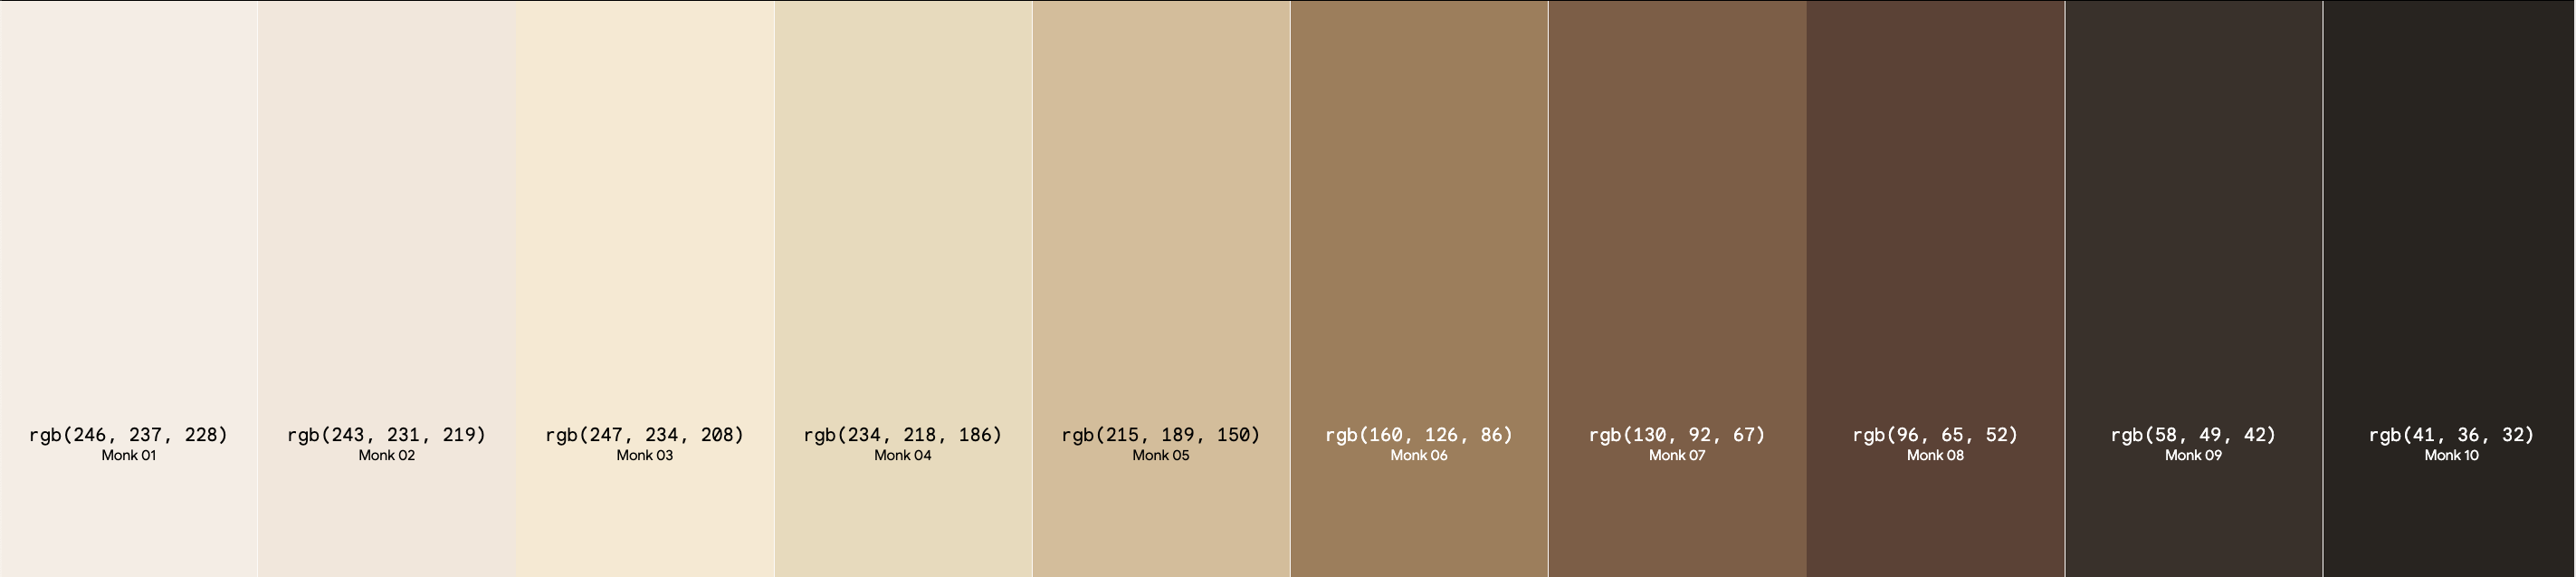
Additionally, some new color scales have been designed with the goal of improving skin tone evaluation in machine learning (ML) and artificial intelligence (AI), rather than for skin pigmentation quantification. The Skin Tone Research @ Google AI partnered with Harvard sociology professor Dr. Ellis Monk to open-source the Monk Skin Tone (MST) Scale, a continuous skin tone spectrum in the form of a 10-tone scale designed to represent a broader range of skin colors. Since AI can perpetuate unfair biases for people with darker skin pigmentation when it comes to camera technologies and image products, the MST is being utilized to evaluate datasets and ML models for better representation.
Interpreting quantitative results
Correlating quantitative measures to a visual color spectrum
Agache 2017 Measuring the Skin, Chapter 6 “The Measurement of Skin Color”:
- Skin color comprises of melanin content, oxy/deoxy-hemoglobin content, and endogenous/exogenous pigments such as bilirubin and carotene
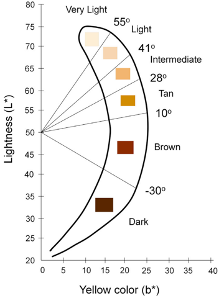
- The CIE L*a*b color space is a device-independent reference for all the colors visible to the human eye and the most commonly used metric to quantify skin color
- Individual Typology Angle (ITA) is calculated from L and b and objectively categorizes skin color into 6 different groups, from very light to dark
Chau et al 2019 Cutaneous Colorimetry as Gold Standard for Skin Color Measurement:
- Explanation of CIE L*a*b color space
- Explanation of how skin colorimeters and spectrophotometers work
Visscher 2017 Skin color and pigmentation in ethnic skin:
- Correlates Fitzpatrick, ITA, Melanin Index
- Correlates Fitzpatrick, ITA, Melanin index
Keywords: skin pigment, Fitzpatrick, melanin, skin color, Colorimeter
Additional References: Okunlola et al, Pulse oximeter performance, racial inequity, and the work ahead, Resp Care, Nov 2021; FDA guidance on pulse oximeters; February 19, 2021 FDA statement “Pulse Oximeter Accuracy and Limitations”: addresses Sjoding’s findings, research limitations, and the need for further study; Sjoding et al, Racial Bias in Pulse Oximetry Measurement, NEJM, Dec 2020
Comparison Table of Quantitative Methods for Assessing Skin Color:
| Konica Minolta CM 700d
· Brochure · Manual |
Courage + Khazaka CL 400
· Brochure |
Delfin SkinColorCatch | |
| Device mechanism | Spectrophotometer | Tristimulus colorimetry with L*a*b color system | Visible spectrum reflectance colorimeter |
| Dimensions | · Dimensions: 73 x 211.5 x 107mm
· Aperture: 3mm or 8mm · Weight: 550g (without cap or batteries) |
· Dimensions: 13cm
· Aperture: 5mm · Weight: 85g |
· Dimensions: 198 x 40 x 35mm
· Aperture: ? · Weight: 145g (with batteries) |
| Illumination | · Light source: pulsed xenon lamp with UV cut filter
· Illuminated area: 6mm vs 11mm depending on aperture · Angle: 8* viewing angle, 2* or 10* observer angle · Wavelength range: 400-700nm |
· Light source: 8 LEDs arranged circularly
· Illuminated area: ~17mm · Wavelength range: 440-670nm |
· Light source: 3 white LEDs arranged circularly
· Illuminated area: 0.3cm^2 · Angle: 45* to minimize gloss · RGB range: 25-246 |
| Power | · Special AC adapter
· 4 AA batteries |
· Plug into MPA device | · 2 AA batteries |
| Measurements | · Eligible ISO 17025 certification
· L*, a*, b* · L*, c*, h* · Yxy · XYZ · Munsell (Hue, Value, Chroma) · Color differences |
· XYZ
· RGB · L*, a*, b* index values (do not fully correspond to ISO) · Calculates ITA |
· Melanin index, Erythema index (insensitive to each other)
· L*, a*, b* index · Calculates ITA · L*, c*, h* · RGB |
| Reliability | · Zero calibration & White calibration functions
· Spectral reflectance: SD <0.1% · Chromaticity value: SD <∆E*ab 0.04 · Inter-instrument agreement: <∆E*ab 0.2 (for 8mm aperture) · Short-term repeatability: higher with continuous measurements and larger aperture size |
· Calibration check function
· Measurement error: +/- 5% · Interobserver reliability: ICC 0.79-0.97 moderate/good (Van der Wal et al 2013) |
· Calibration check function
· Not affected by ambient light due to direct skin contact · Optical orifice designed to minimize pressure induced skin blanching |
| Data transfer | · Mini USB cable
· Bluetooth? |
MPA device dependent:
· Standalone display · Mini USB cable · Wireless |
· Bluetooth cable (wireless receiver unit) |
| Software | CM-SA Skin Analysis software
· Brochure · Manual (Windows PC) |
MPA CTplus software
· Includes RHT 400 for ambient temperature and humidity MPA System software (old) · Brochure (Windows PC) |
Delfin Modular Core (DMC) software
· Includes RoomSensor for ambient temperature and humidity (Windows PC) |
| Data | · Measurements above
· Melanin index · Hb index · Hb SO2 index |
· Measurements above | · Measurements above
· Tabulated by Sites, Sessions, Subjects, and Instruments · Note: Automatically takes measurements in order of Session instead of Site which is less reliable (requires removing & reapplying probe at each site) |
| Graphics | · Hue / Value graph
· Hb index / Melanin index graph |
Yes | Yes |
| Export to CSV | · Data above
· Spectral reflectance (400-700na)*2 · Does NOT include ITA: · Does NOT include RGB: |
Yes | Yes
· But exports each parameter as separate file · Can export data horizontally or vertically |
| Literature | · C+K | · Delfin |
Table of Studies Comparing Quantitative Methods:
| Study | Devices |
| Wang et al, 2018 | CM-700d Spectrophotometer (Minolta)
PR-650 Telespectroradiometer (PhotoResearch |
| Globale Dermatologie
|
Chromameter (Minolta)
Mexameter (C+K) DermaCatch (Colorix) |
| Matias et al, 2015 | Mexameter MX-18 (C+K)
Colorimeter CL-400 (C+K) Antera (Miravex) |
| Van der Wal et al, 2013 | Mexameter MX-18 (C+K)
Colorimeter CL-400 (C+K) DSM II ColorMeter |
| Measurement of Skin by Agache | Chromameter (Minolta)
Derma Spectrophotometer (Cortex) Mexameter (C+K) DermaCatch (Colorix) |
| Baquie & Kasraee, 2014 | Mexameter MX-16 (C+K)
DermaCatch (Colorix) |
| Uter et al, 2013 | Chromameter CR-300 (Minolta)
Reflektometer RM-100 |
| Barel et al, 2001 | Visi-Chroma VC-100
Chromameter CR-200 (Minolta) |
| Kerckhove, 2001 | Chromameter CR-300 (Minolta) |
Note: DermaCatch (Colorix) is now SkinColorCatch (Delphin)
Recent studies using data from 54 countries have shown that about 77,700 operating rooms worldwide do not have pulse oximeters. When accounting for other clinical practice settings such as post-op recovery units and intensive care units, the ‘oximetry gap’ is likely much greater. Barriers to access include cost, supply chain, and incorporation into local practice guidelines.
References: Funk et al, Lancet 2010; Gibbs et al, What is the real oximeter gap?, Anaesthesia, 2017
Keywords: access, operating rooms, equipment
As patient status can change rapidly during anesthesia, a qualified anesthesia provider should be present continuously to monitor the patient and provide anesthetic care. The American Society of Anesthesiologists has determined standards for basic anesthetic monitoring, which state that “during all anesthetics, the patient’s oxygenation, ventilation, circulation and temperature shall be continually evaluated.”
Regarding blood oxygenation and SpO2 measurement during anesthesia, ASA standards state that “a quantitative method of assessing oxygenation such as pulse oximetry” should be used at all times. It is important that the volume, pitch, and low threshold alarm noises be audible to the anesthesia care team personnel throughout the duration of anesthesia.
References: ASA Monitoring Requirements
Keywords: anesthesia, monitoring, frequency
Monitoring SpO2 is a critical part of managing patients with respiratory failure. The frequency of monitoring should take into consideration the severity of the patient’s illness and be tailored to the individual patient at the provider’s discretion. Here are some considerations:
- For patients with mild disease, SpO2 should be checked on initial assessment.
- For patients with moderate disease, SpO2 should be monitored intermittently (about every four hours).
- For patients with severe or critical disease, SpO2 should be monitored continuously or as frequently as possible.
For more information on routine monitoring and patient care, use this Charting Tool from the OpenCriticalCare.org project.
References: Charting Tool Templates for COVID19 Care
Keywords: monitoring SpO2, respiratory failure, COVID
While SpO2 can be useful in many cases, there are certain situations where an arterial blood gas (ABG) should be drawn and analyzed. If the pulse oximeter shows a tracing that is dampened or erratic, or low PI or signal quality indicator, this may indicate that the SpO2 readings are unreliable and an ABG is warranted. Also, if there are any other factors present that might reduce the pulse oximeter’s accuracy (such as poor perfusion, low body temperature, etc.), an ABG should be obtained.
Other reasons to get an arterial blood gas include if there is a clinical suspicion of Met-Hb, CO-Hb, S-Hb, or other hemoglobin types. Additionally, pulse oximetry does not provide information about ventilation or acid-base status, so an ABG is needed in situations where this information is also needed.
Keywords: ABG, arterial, blood gas
Not necessarily. This commonly recited myth stems from the fact that oximeters are only tested in clinical validation studies down to 70% SpO2 due to the stated requirement by the FDA and also because of limitations by institutional review boards. So, while oximeters are not usually validated clinically below SpO2 70%, and oximeter performance becomes less accurate at lower SpO2, oximeter readings below 70% should not be disregarded. Widely inaccurate SpO2 values below ~SpO2 70% are more often due to poor signal in the context of a critically ill patient with poor perfusion, rather than an inherent limitation in inherent oximeter technology.
Keywords: accuracy, inaccurate
Pulse oximeters can be used to measure many different clinically important values. Some (but not all) pulse oximeters can measure the following:
- Respiratory rate
- Perfusion
- Carboxyhemoglobin
- Methemoglobin
- Hemoglobin concentration
- Pulsatility variation
Keywords: measurement, respiratory rate, pulsatility variation
Pulse oximeter measurements can be influenced by many variables such as skin pigment, body temperature, nail polish, movement, and perfusion. If the waveform tracing is erratic and low amplitude, this might be due to a weak signal or due to the patient moving. This can make it difficult for the oximeter to interpret the oxygen saturation accurately. Common reasons for poor waveform can include poor perfusion, irregular heart rate, or poor probe placement. All of these factors can cause both underestimation and overestimation errors in oxygen saturation readings.
References: Lifebox Pulse Oximetry Learning Module
Keywords: waveform, perfusion, battery, error

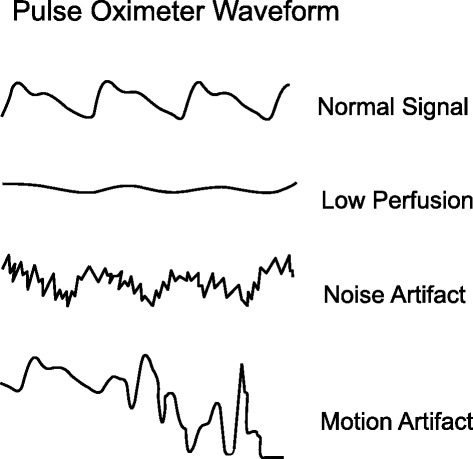
A pulse oximeter photoplethysmograph (commonly referred to as a ‘pleth’) is a graphical display of the pulse oximeter signal over time. Its appearance can vary widely under different clinical scenarios. In healthy patients, the graph should appear as asymmetric humps similar in appearance to an arterial pressure waveform though usually with less level of detail (i.e. the dicrotic notch may not be visible). The waveform should appear at intervals that match the heart rate and regularity.
Patient motion, tremor and poor perfusion are common factors that affect the pleth. The pleth is an extremely useful feature to help clinicians quickly determine the quality of the oximeter signal. Of note, in the face of a low signal (or low perfusion) some oximeters may auto adjust the scale of the display (y axis) to increase the visual amplitude of the pleth. This can be misleading to clinicians who must also pay attention to signal quality indicators when available.
References: Jubran, Crit Care 2015
Keywords: pleth, waveform, PPG
The CE marking is a mark that manufacturers must obtain in order for their devices or products to be sold within the European Union (EU). Each company has a notified body that is paid by the company to ensure ISO compliance. The company must demonstrate to the notified body that the device meets the ISO standard. This marking signifies that the product is in compliance with European health, safety, and environmental protection standards. The CE marking may also be found on products sold outside of the EU that have been manufactured to these standards.
The CE marking is required for medical devices, and having it confirms that the device meets essential requirements of the European General Medical Devices Directive and that it is safe. Of note, the CE marking is not a quality indicator or a certification mark, but it does indicate that the device complies with EU regulations and can legally be sold.
Additionally, falsification of CE marking is commonly encountered.
References: European Commission CE Marking
Keywords: CE, marking, european general medical devices directive, EEA

An IP rating, also known as the ingress protection rating, is the rating of a product’s ability to withstand liquid and dust. IP ratings were defined and developed by the International Electrotechnical Commission (IEC), and are recognized all over the world.
The IP code is composed of two numbers:
- The first number rates the device’s protection against solid particles (i.e. dust). It is rated from 0 (no protection) to 6 (full protection).
- The second number rates the device’s protection against liquids. It is rated from 0 (no protection) to 9 (protection from high-pressure, high-temperature liquid).
References: IEC: IP Ratings
Keywords: IP, ingress protection, dust, liquid, IEC
A molar extinction coefficient is a measure of the absorption of light at a particular wavelength by a substance of known concentration. Specifically, it is the measure of how much light is absorbed per unit length (i.e. centimeters) by one mole of the substance.
In pulse oximetry, the molar extinction coefficient is used to calculate the concentration of oxygenated and deoxygenated hemoglobin in blood based on the absorption of light at two different wavelengths (usually 660 nm and 940 nm) by the hemoglobin molecules.
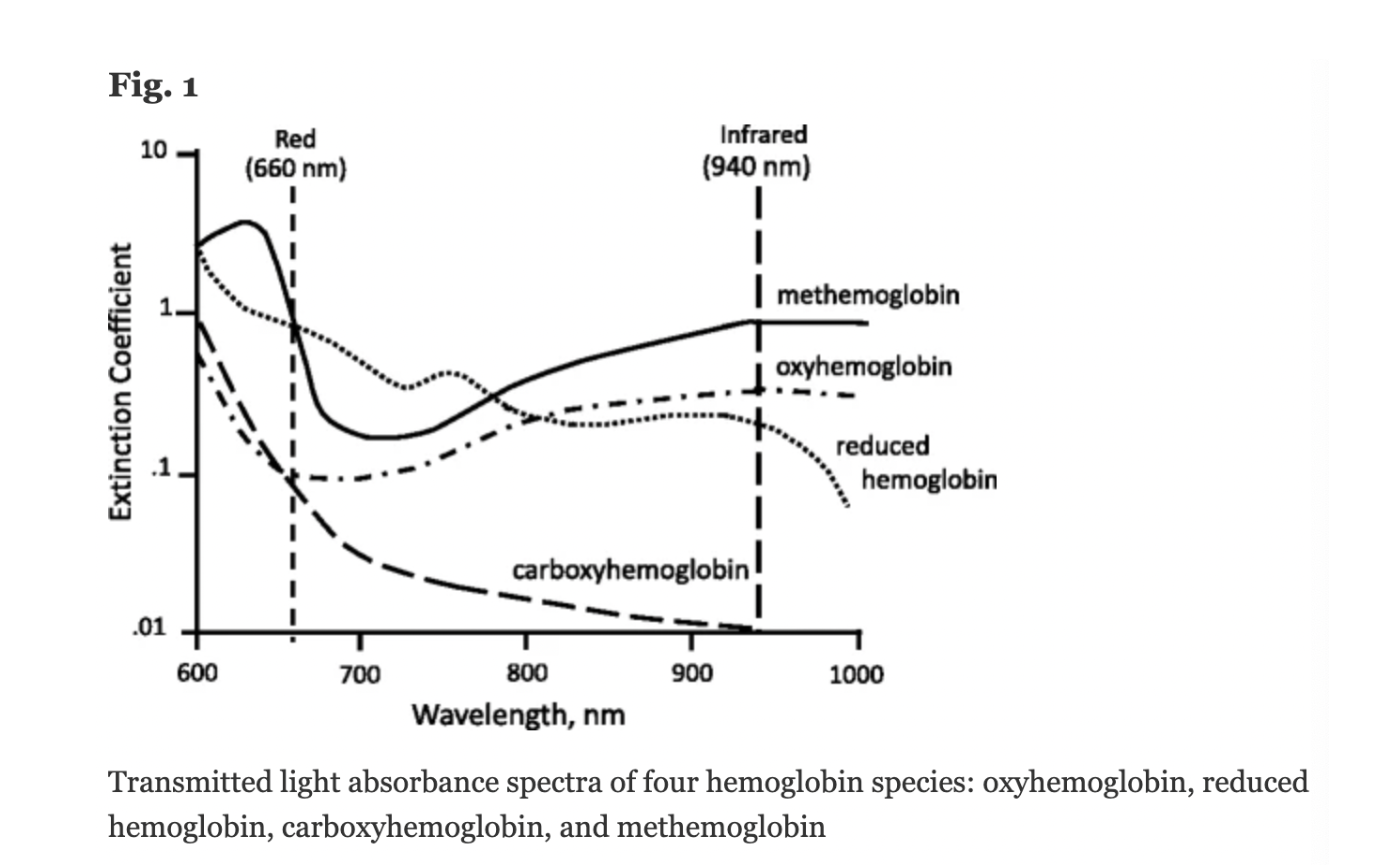
Figure: Jubran, Critical Care, 2015
Keywords: molar extinction coefficient, extinction coefficient, hemoglobin,
References: Jubran, Critical Care, 2015 Chan et al, Respiratory Medicine 2013
SpO2 is the functional oxygen saturation measured by pulse oximetry. A normal SpO2 reading is usually considered to be above 94%. An SpO2 of 90-94% can signal that a patient may have a new or chronic respiratory problem, or that they may be progressing to hypoxemia. Many clinical definitions of hypoxemia (i.e. low oxygen concentration in the blood) use a cutoff of 90%, though depending on the context, SpO2 values above 90% may be abnormal (e.g. a healthy, young adult at sea level should be 96-100%. Similarly, depending on the context, an SpO2 less than 90% may be physiologically appropriate (e.g. at high altitude). Read more about the “Optimal SpO2 target for Patients with Respiratory Failure”
References: Lifebox Pulse Oximetry Learning Module
Keywords: normal SpO2, hemoglobin

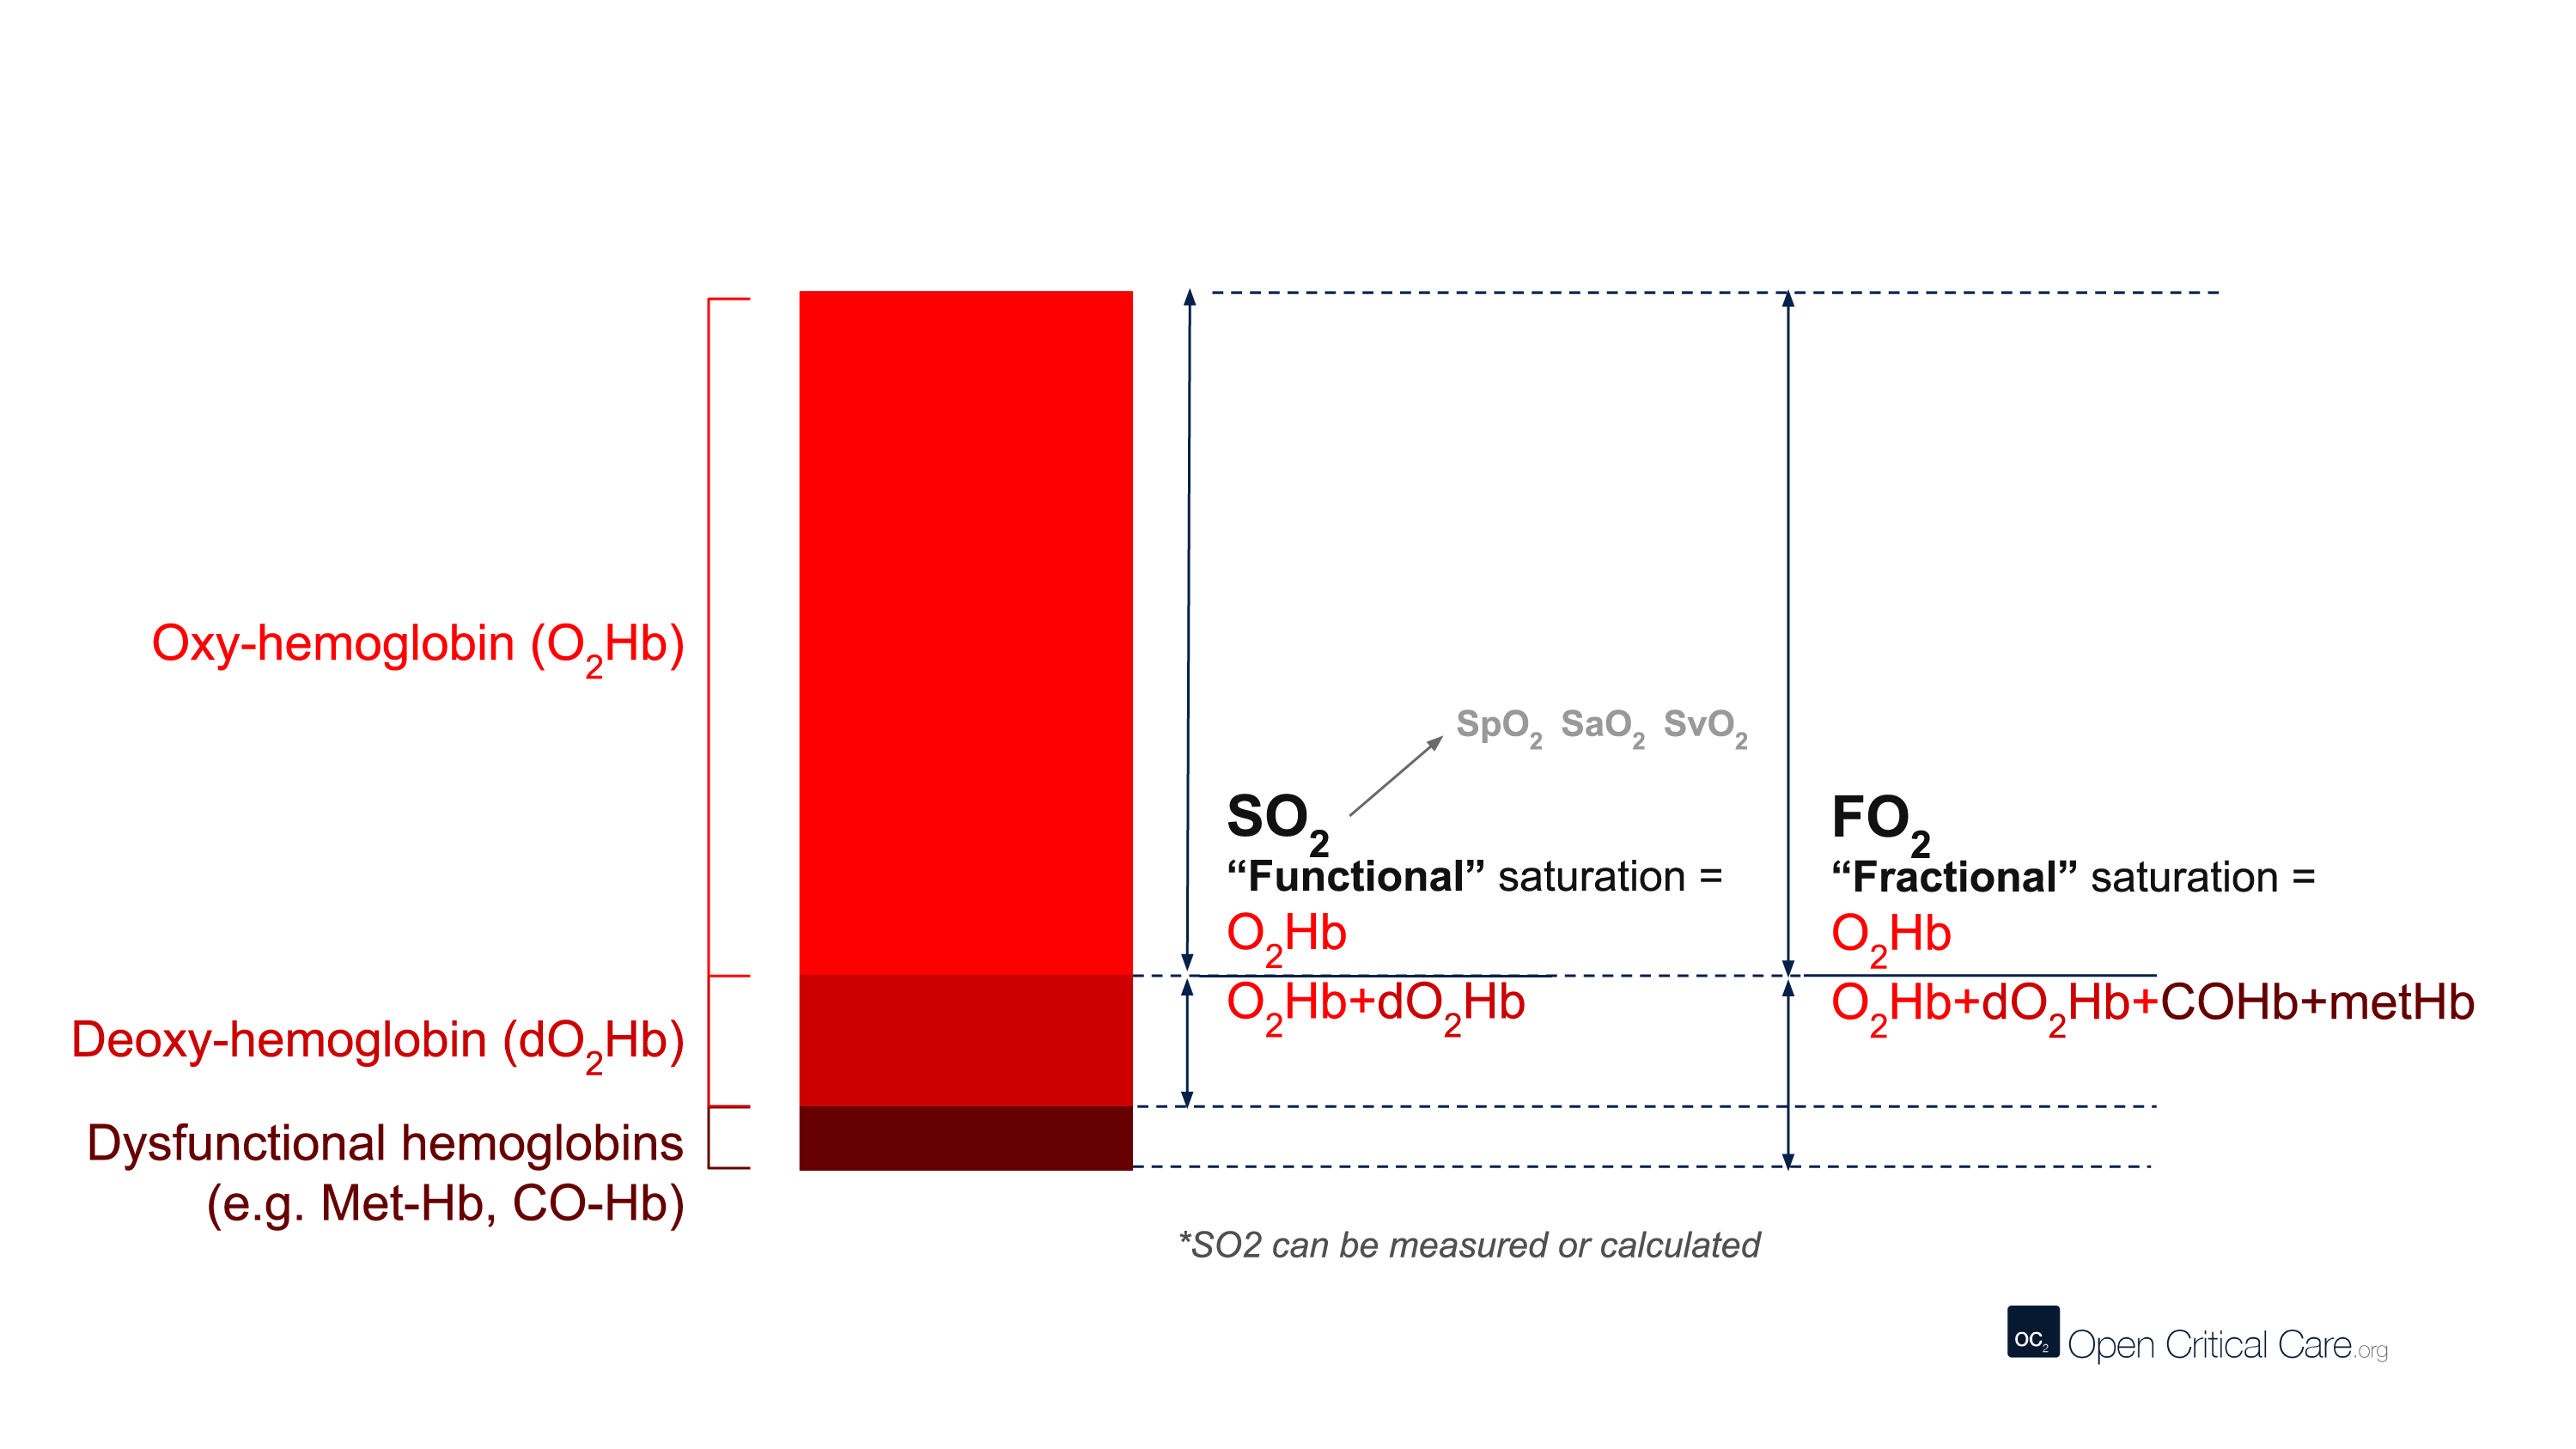
The term CO-oximetry refers to devices that use at least four wavelengths of light to measure not only oxy and deoxy-hemoglobin, but also other forms of hemoglobin (e.g. CO-Hb, Met-Hb). While most conventional pulse oximeters use two wavelengths of light and can only detect oxyhemoglobin or deoxy-hemoglobin (to provide a functional saturation, sO2), some pulse oximeters contain many more wavelengths and the ability to function as ‘pulse CO-oximeters.’ With more wavelengths, these devices can measure dyshemoglobins and provide “fractional” oxygen saturation – see image below. (Note: these devices are clearly marked with this function and often are considerably more expensive than other devices).
Despite this, the term ‘CO-oximeter’ is often used synonymously with ‘arterial blood gas analyzer’ because historically it was only multi-function arterial blood gas analyzers that possessed CO-oximetry functionality. Some pulse CO-oximeters have ~10 wavelengths of light, whereas benchtop CO-oximeters may use 128 to 256 wavelengths of light.
Of note, the terms “CO-oximeter” and “Hemoxemeter” are brand names coined by the companies Instrumentation Laboratories and Radiometer, respectively. The generic term for a device with these capabilities is a “multi-wavelength oximeter,” but the term “CO-oximeter” is widely used to refer to these devices, regardless of brand.
Keywords: CO-oximetry, arterial, carboxyhemoglobin, methemoglobin
The International Organization for Standardization (ISO) is a worldwide standard-setting body. It is composed of representatives from several national standards organizations and aims to provide common standards for technology, agriculture, healthcare, and other manufactured products. These standards are meant to ensure that products and services are safe and of good quality.
ISO has standards for various healthcare-related devices and products, including pulse oximeters. ISO 80601-2-61:2017 describes the requirements for basic safety and essential performance of pulse oximeter equipment. This also includes standards for the pulse oximeter monitor, pulse oximeter probe, and probe cable extender.
References: ISO: Pulse Oximeter
Keywords: ISO, international organization for standardization
There are many different terms that are frequently (and sometimes incorrectly) referred to as ‘oxygen saturation.’ Here we define them:
- ‘Oxygen saturation’ – A quantification of the proportion of hemoglobin inside red blood cells that is bound by oxygen. This can refer to multiple measurements, but most commonly is used to refer to functional arterial oxygen saturation.
- SO2 or ‘functional oxygen saturation’ – The fraction of effective hemoglobin (e.g. excluding Hb species like CO-Hb or met-Hb and only measures oxy- and deoxy-Hb). This is expressed as (HbO2/[Hb+HbO2]).
- SpO2 – Functional, arterial oxygen saturation measured by pulse oximetry.
- FO2Hb or ‘fractional oxygen saturation’ – The fraction of total hemoglobin (Hb) that is carrying oxygen. Total Hb includes not only oxy- and deoxy-Hb, but also other hemoglobin species like Met-Hb, CO-Hb, S-Hb. Fractional oxygen saturation can be measured by relatively few pulse oximeters, and usually requires blood gas analysis and a capable co-oximeter. This is expressed as (HbO2/[Hb+HbO2+MetHb + COHb + SHb]).
- SO2 or SaO2 – Arterial oxygen saturation measured by arterial blood gas.
- SvO2 – Venous oxygen saturation.
- ScvO2 – Central venous oxygen saturation.
Keywords: oxygen saturation, SpO2, SaO2, SvO2, SO2
Spectrophotometry is a type of quantitative measurement technique that is used to measure the reflection or transmission properties of a substance as a function of wavelength. Every type of substance absorbs light over a specific range of wavelengths. This type of measurement allows us to assess the intensity of light that a substance (such as hemoglobin in blood) absorbs, and therefore has clinical and bioengineering applications.
Clinically, spectrophotometry is used in pulse oximeters to determine the proportion of oxygenated hemoglobin in arterial blood. Since different wavelengths of light are absorbed by oxygenated and deoxygenated blood, pulse oximeters can use this technique to determine a patient’s peripheral oxygen saturation (SpO2).
Keywords: spectroscopy, spectrophotometry, wavelength, light
There are two main types of pulse oximeter: transmittance devices and reflectance devices. Transmittance pulse oximeters are the most common and work by transmission (i.e. shining a light) through tissue, usually a fingertip or ear. As the light passes through the body part, the amount of oxygen in the blood determines how much light is absorbed in the tissue. A light detector on the other side of the probe detects light that is not absorbed, and a microprocessor calculates the oxygen saturation in the blood. Reflectance pulse oximeters are placed on the skin surface and measure the light reflected off the tissues rather than through the tissue. In this way, absorption is measured to calculate oxygen saturation. Of note, reflectance devices are inherently more difficult to design to perform well.
References: Lifebox Pulse Oximetry Learning Module
Keywords: transmittance, reflectance, light, absorption

To receive FDA approval on a new device intended for human use, a premarket submission called a 510k must be made to the FDA. This must demonstrate that the device is substantially equivalent to a legally marketed device, meaning that it is just as safe and effective.
According to the FDA, a device is considered “substantially equivalent” if the following criteria are met:
- Has the same intended use as the predicate device; and
- Has the same technological characteristics as the predicate;
OR - Has the same intended use as the predicate; and
- Has different technological characteristics and does not raise different questions of safety and effectiveness; and
- The device is demonstrated to be as safe and effective as the legally marketed device
Once this information has been submitted to the FDA, the FDA will determine whether the device is safe and effective through a thorough review process, including evaluation of performance data and technological characteristics. In the US, a device may not be marketed until the FDA determines that substantial equivalence is present.
References: FDA Premarket Notification 510(k)
Keywords: substantially equivalent, SE, FDA, 510k
In the context of pulse oximetry, the modulation ratio is a measure of the amplitude modulation of the light transmitted through the tissue due to the presence of pulsatile arterial blood. It is defined as the ratio of the AC (alternating current) component to the DC (direct current) component of the transmitted light signal
The modulation ratio is used in pulse oximetry to determine the accuracy and reliability of the measured oxygen saturation (SpO2) values. A higher modulation ratio indicates a stronger pulsatile signal and better signal-to-noise ratio, resulting in more accurate and reliable SpO2 readings.
According to a study by Allen et al. (2007), the modulation ratio is typically in the range of 1% to 3% for healthy adults. However, the modulation ratio may be lower in patients with low perfusion, weak pulse, or other physiological conditions that affect the pulsatility of arterial blood flow. In such cases, the accuracy and reliability of the SpO2 readings may be compromised.
Keywords: modulation ratio, R-value
Reference: Allen, J. (2007). Photoplethysmography and its application in clinical physiological measurement. Physiological Measurement, 28(3), R1-R39.
The optimal SpO2 for patients with respiratory failure has not been well established and is still being evaluated. The World Health Organization (WHO) guidance for patients with hypoxemic respiratory failure due to COVID-19 recommends the following targets: Initial SpO2 of >94% for stabilization, then >90% for stable patients who are not pregnant or 92-95% for stable patients who are pregnant. It is important not to make SpO2 goals too high, as this can cause oxygen toxicity and will deplete the oxygen supply more quickly. For more discussion on optimal SpO2 goals in patients with respiratory failure, please read more here.
References: WHO SARI Toolkit
Keywords: target SpO2, goal, respiratory failure, COVID-19
The optimal target for oxygen saturation (SpO2) in patients with acute hypoxemic respiratory failure is unknown. Hypoxemia causes pulmonary vasoconstriction and pulmonary hypertension in its chronic form, and death when it is acute and severe. Hyperoxemia also causes physiologic disturbances, through toxic reactive oxygen species and absorption atelectasis.1
The World Health Organization (WHO) interim guidance for patients with hypoxemic respiratory failure due to COVID-19 suggests an initial SpO2 target >94% for stabilization, then >90% for non-pregnant patients and 92-95% for pregnant patients, once stable.2 The summary of evidence below suggests another reasonable target might be SpO2 90-96%, and perhaps 92-96% in settings with only intermittent pulse oximetry monitoring, or in patients with darker skin pigmentation.
The evidence
Several recent studies have examined conservative versus liberal oxygenation targets, with mixed results (See Table). In 2016, a before and after stepwise implementation study found a trend toward improved clinical outcomes with SpO2 target of 92-95% and PaO2 target of 55-86 mmHg as compared with earlier higher targets in ICU patients.3 Also in 2016, a single-center, open-label, randomized clinical trial compared targets of SpO2 94-98%/paO2 70-100 mmHg versus SpO2 97-100%/paO2 up to 150 mmHg in ICU patients, and found a mortality benefit with the lower target; however, the study was stopped early due to poor enrollment after a natural disaster, so its results cannot be considered definitive.4
In 2020, two multicenter randomized trials published together in the New England Journal of Medicine produced different results. One compared targets of SpO2 88-92%/paO2 55-70 mmHg with SpO2>=96%/PaO2 90-105 mmHg in ARDS patients, and was stopped early for suggestion of harm in the lower-SpO2 target arm.5 The other compared one arm with a target SpO2<97% with an arm with no maximum target SpO2 limit (lower limit 90% for both arms) in mechanically ventilated patients, and found no difference in ventilator-free days or 180-day mortality.6
Finally, in a 2021 multicenter randomized trial also in the New England Journal of Medicine, investigators randomized almost 3,000 ICU patients with acute hypoxemic respiratory failure to receive PaO2 targets of either 60 mmHg or 90 mmHg.7 The median SpO2 in the higher-target group was 96% (IQR 95-97%), and in the lower-target group was 93% (IQR 92-94%). The study found no difference in 90-day mortality.
The evidence taken together suggests that a target range that avoids both hypoxemia and hyperoxemia may be beneficial. A reasonable example target range based on the above evidence is SpO2 of 90-96%.
Other considerations
Other factors may need to be considered when deciding on a Spo2 target range:
1) Resource-variable settings:
- Lower target saturations can conserve scarce oxygen resources, making more oxygen available for more patients who need it; a hospital Emergency Department in Rwanda found that a target of 90-95% resulted in better oxygen supply reserves for the hospital, as compared with previous higher SpO2 targets.8
- Intermittent pulse oximetry monitoring (versus continuous) could increase the risk for periods of undetected hypoxemia.1 This could be an argument for a slightly higher target, for example 92-96%.
- The accuracy of inexpensive pulse oximeters without regulatory approval is variable.9 Using validated oximeters and following trends in SpO2 rather than individual measurements, and/or checking saturations with more than one device, may help mitigate this concern.
2) Race and skin pigmentation: Data suggest that pulse oximetry more frequently under reports hypoxemia in patients who self-identify as Black, as compared with patients who self-identify as White.10 While more work needs to be done with specific devices and with documentation of a validated range of skin pigmentations, it may be reasonable currently to target higher ranges in patients with darker skin tones, for instance 93-96%.
3) Altitude: Geographic variation in elevation above sea level may necessitate adjustment in SpO2 targets. Baseline SpO2 values in healthy people will be lower at higher elevation due to decreases in the partial pressure of oxygen.
4) Other conditions: The recommendations here are related to acute hypoxemic respiratory failure. Other conditions may necessitate higher or lower targets. For example, a COPD exacerbation in a patient with chronic hypercarbic respiratory failure should likely have a lower target of 88% to avoid worsening of hypercarbia. Pregnant patients generally have higher SpO2 goals.2
British Medical Journal (BMJ) Rapid Recommendations, 2018
Acutely Ill Medical Patients
- Target SpO2 < 96% for acutely ill patients requiring supplemental oxygen
- Do not start supplemental oxygen in patients with SpO2 93-100%
American Association of Respiratory Care, 2002
All patients in acute care facility
- Provide supplemental oxygen for SpO2 < 90%
British Thoracic Society, 2017
Acute medical conditions Provide oxygen if SaO2 <94% for most acutely ill patients; <88% for patients with hypercapnia 98% for most patients, 92% for patients with hypercapnia
- Provide oxygen if SaO2 <94% for most acutely ill patients; <88% for patients with hypercapnia
- Upper limit of target range 98% for most patients, 92% for patients with hypercapnia
Thoracic Society of Australia and New Zealand, 2015
Acute medical conditions
- Provide oxygen if SpO2 <92% for most acutely ill patients; <88% for patients with COPD and some other forms of chronic respiratory failure
- Target SpO2 92-96%
World Health Organization, 2020[ER3]
Patients with Severe Acute Respiratory Infection (SARI)
- Provide oxygen if SpO2 <90%, no upper limit specified
- Target SpO2 88-93% in patients with ARDS from SARI
National Institute of Health, 2020
Patients with COVID-19 infection
- Target SpO2 92-96%
Society of Critical Care Medicine
Patients with COVID-19 Infection
- Suggest starting supplemental oxygen if SpO2 <92 and recommend starting supplemental oxygen if SpO2 <90
- Target SpO2 92-96%
- Strongly recommend upper limit of 96%
ARDSNet, 2008
Intubated patients with ARDS
- 88-95%
Citations
- Angus DC. Oxygen Therapy for the Critically Ill. N Engl J Med 2020;382:1054-6.
- World Health Organization. Clinical management of severe acute respiratory infection (SARI) when COVID-19 disease is suspected: Interim guidance. 2020 March 13.
- Helmerhorst HJ, Schultz MJ, van der Voort PH, Bosman RJ, Juffermans NP, de Wilde RB, van den Akker-van Marle ME, van Bodegom-Vos L, de Vries M, Eslami S, de Keizer NF, Abu-Hanna A, van Westerloo DJ, de Jonge E. Effectiveness and Clinical Outcomes of a Two-Step Implementation of Conservative Oxygenation Targets in Critically Ill Patients: A Before and After Trial. Crit Care Med 2016;44:554-63.
- Girardis M, Busani S, Damiani E, Donati A, Rinaldi L, Marudi A, Morelli A, Antonelli M, Singer M. Effect of Conservative vs Conventional Oxygen Therapy on Mortality Among Patients in an Intensive Care Unit: The Oxygen-ICU Randomized Clinical Trial. Jama 2016;316:1583-9.
- Barrot L, Asfar P, Mauny F, Winiszewski H, Montini F, Badie J, Quenot JP, Pili-Floury S, Bouhemad B, Louis G, Souweine B, Collange O, Pottecher J, Levy B, Puyraveau M, Vettoretti L, Constantin JM, Capellier G. Liberal or Conservative Oxygen Therapy for Acute Respiratory Distress Syndrome. N Engl J Med 2020;382:999-1008.
- Mackle D, Bellomo R, Bailey M, Beasley R, Deane A, Eastwood G, Finfer S, Freebairn R, King V, Linke N, Litton E, McArthur C, McGuinness S, Panwar R, Young P. Conservative Oxygen Therapy during Mechanical Ventilation in the ICU. N Engl J Med 2020;382:989-98.
- Schjørring OL, Klitgaard TL, Perner A, Wetterslev J, Lange T, Siegemund M, Bäcklund M, Keus F, Laake JH, Morgan M, Thormar KM, Rosborg SA, Bisgaard J, Erntgaard AES, Lynnerup AH, Pedersen RL, Crescioli E, Gielstrup TC, Behzadi MT, Poulsen LM, Estrup S, Laigaard JP, Andersen C, Mortensen CB, Brand BA, White J, Jarnvig IL, Møller MH, Quist L, Bestle MH, Schønemann-Lund M, Kamper MK, Hindborg M, Hollinger A, Gebhard CE, Zellweger N, Meyhoff CS, Hjort M, Bech LK, Grøfte T, Bundgaard H, Østergaard LHM, Thyø MA, Hildebrandt T, Uslu B, Sølling CG, Møller-Nielsen N, Brøchner AC, Borup M, Okkonen M, Dieperink W, Pedersen UG, Andreasen AS, Buus L, Aslam TN, Winding RR, Schefold JC, Thorup SB, Iversen SA, Engstrøm J, Kjær MN, Rasmussen BS. Lower or Higher Oxygenation Targets for Acute Hypoxemic Respiratory Failure. N Engl J Med 2021.
- Sutherland T, Moriau V, Niyonzima JM, Mueller A, Kabeja L, Twagirumugabe T, Rosenberg N, Umuhire OF, Talmor DS, Riviello ED. The “Just Right” Amount of Oxygen. Improving Oxygen Use in a Rwandan Emergency Department. Ann Am Thorac Soc 2019;16:1138-42.
- Lipnick MS, Feiner JR, Au P, Bernstein M, Bickler PE. The Accuracy of 6 Inexpensive Pulse Oximeters Not Cleared by the Food and Drug Administration: The Possible Global Public Health Implications. Anesth Analg 2016;123:338-45.
- Sjoding MW, Dickson RP, Iwashyna TJ, Gay SE, Valley TS. Racial Bias in Pulse Oximetry Measurement. N Engl J Med 2020;383:2477-8.
Pulse oximetry plays a key role in the diagnosis, triage and management of COVID-19 patients. This includes when to initiate hospitalization or oxygen therapy and when to escalate or deescalate oxygen therapy. This can be an essential tool for conserving oxygen supply as well.
Hypoxemia is a key finding in many patients with COVID-19. Up to 80% of patients with COVID-19 may have only mild symptoms or be completely asymptomatic. Common initial symptoms of COVID-19 infection include fever, cough, headache, fatigue, and myalgias. About 15% of infected patients develop severe disease, and about 5% develop critical illness – these patients may require supplemental oxygen. It has been reported that many patients with COVID-19 have more significant hypoxemia than their symptoms might suggest, which has been referred to as “happy” or “silent” hypoxia. Therefore, it is essential to check SpO2 for all patients with known or suspected COVID-19 infection who are symptomatic or report for medical evaluation.
References: Lifebox Pulse Oximetry Learning Module
Keywords: COVID-19, symptomatic, shortness of breath, SOB, coronavirus, oxygen
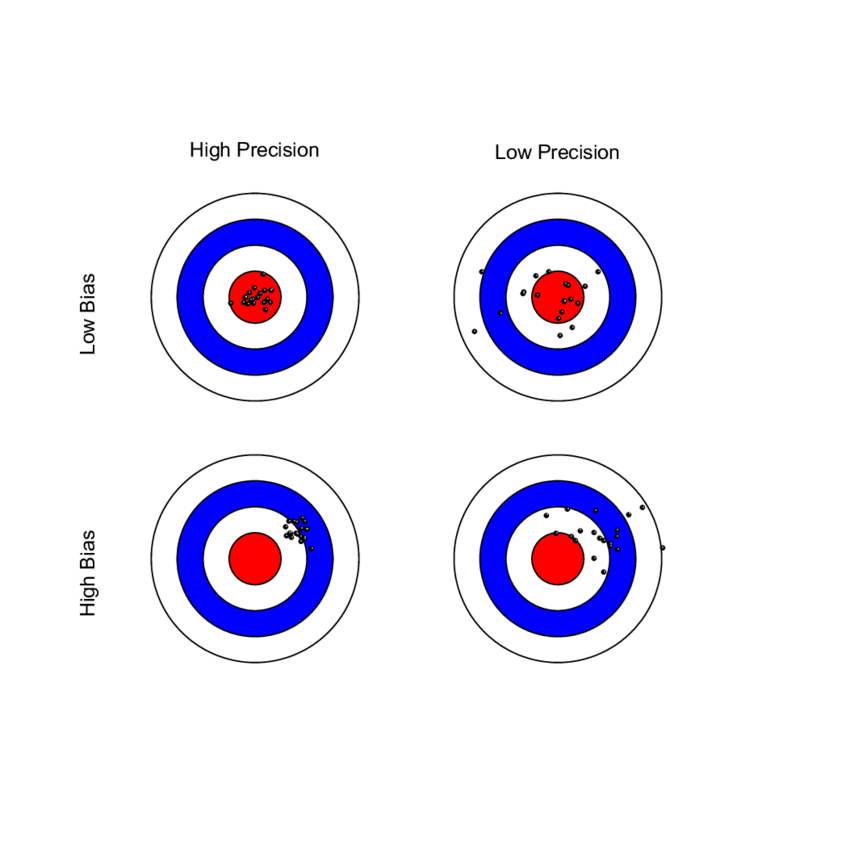
The Average Root Mean Square error or root mean square deviation (known as ARMS) is an established measure of SpO2 performance and is used by regulatory agencies to determine how accurately a pulse oximeter performs. Sometimes referred to as “Accuracy Root Mean Square error, ARMS is the square root of the mean of the squared deviations between the pulse oximeter SpO2 measurement and the SaO2 measurement. ARMS approximates the mean absolute deviation (MAD) between SpO2 and SaO2. It is always a positive value, so it cannot indicate whether SpO2 is negatively or positively biased for SaO2.
ARMS is calculated by combining both the bias and the standard deviation into one value. The FDA recommends an acceptable limit of ARMS ≤3% for transmittance devices and ARMS ≤3.5% for reflectance devices. If either component (bias or SD) is very large (i.e. inaccurate), the ARMS will be greater than the acceptable limit and will not be considered a well performing pulse oximeter. If a pulse oximeter device has an ARMS ≤3%, this means that it did not have a large scatter or large outliers in the data, and therefore can accurately measure SpO2. It is important to recognize that even a small difference in ARMS between devices can reflect a large difference in their performance.
ARMS is best referred to as a measure of performance (rather than accuracy).
References: FDA Guidelines; Clinical Application of ARMS in Pulse Oximetry – Clinimark June 2021; Brandmaier et al, Elife 2018
Keywords: bias, standard deviation, Arms, ARMS
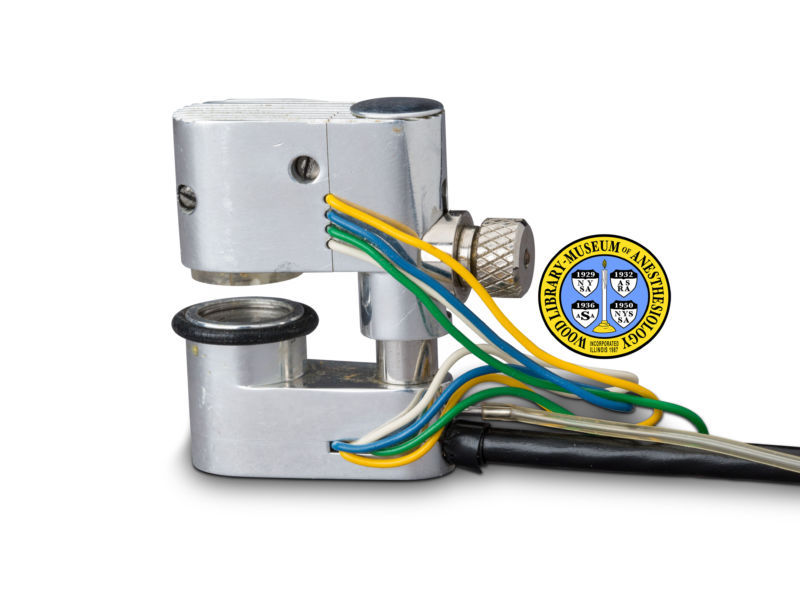
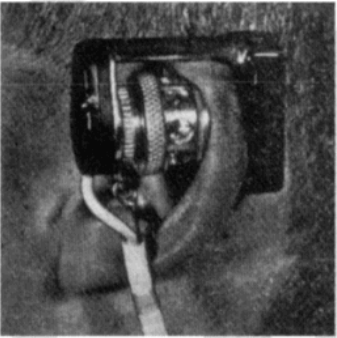
In 1940, J.R. Squire was the first to recognize that the differences in transmission of red and infrared light permitted oxygen saturation to be computed. In 1942, the British scientist Glen Millikan developed the first portable pulse oximeter to be used during pilot training in World War II. The device was placed on the earlobe and was used to monitor pilots’ oxygen saturation and safety during flight.
Thirty years later in 1972, the Japanese bioengineer Takuo Aoyagi developed conventional pulse oximetry by using the ratio of red to infrared light absorption in pulsating (arterial) blood to calculate oxygen saturation. This was later commercialized and gradually integrated into clinical practice in the 1980s and 1990s. Notably, the American Society of Anesthesiologists determined in 1986 that using pulse oximetry was to be recognized as the new standard of care. To learn more history about the development of the pulse oximeter, read here.
References: Severinghaus et al, J Clin Monit 1986; Millikan, Rev Sci Instrum 1942; Severinghaus, Anesth Analg 2007, Wood Library Museum of Anesthesiology
Keywords: first, invention, Millikan, Aoyagi
The locations for placing pulse oximeters vary by the type of device and probes available, including whether it is a transmittance or a reflectance device. Transmittance devices shine light through a part of the body, so they must be placed on a relatively thin or translucent area such as a fingertip, earlobe, nose or the foot of an infant. It is important that the body part is placed far enough into the probe so that the light shines through the tissue rather than to the side of it. Reflectance devices do not require light to pass through tissue, so they can be placed in a variety of locations including the patient’s forehead, wrist, foot, or chest.
References: Lifebox Pulse Oximetry Learning Module
Keywords: body part, location, placement, finger
Conventional pulse oximeters assume that the major absorbers of light within arterial blood are deoxygenated hemoglobin (HHb) and oxygenated hemoglobin (O2Hb) and calculate SpO2 based on the ratio of measured absorbance of only two wavelengths of light (660nm and 940nm). Methemoglobinemia (MetHb) occurs when the iron in hemoglobin is oxidized, altering its ability to bind and offload oxygen.
The molar extinction coefficient of MetHb at 660 nm red light is approximately 1 and approximately equal to the molar extinction coefficient of HHb (see image below). The molar extinction coefficient of MetHb at 940 nm infrared light is also approximately 1 and significantly higher than the molar extinction coefficient of O2Hb. As a result of MetHb absorbing 660 nm and 940 nm light approximately equally, the Modulation Ratio (R-Value) approaches 1, this corresponds to an SpO2 of 80-88%. This can result in either an overestimation or an underestimation of SaO2 levels.
When a patient is cyanotic and methemoglobinemia is suspected, a co-oximeter capable of measuring the absorbance of greater than 2 wavelengths of light is necessary to determine fractional oxygen saturation and MetHb levels.
Figure: Jubran, Critical Care, 2015
Keywords: Dyshemoglobin, Methemoglobin, Methemoglobinemia,
References: Jubran, Critical Care, 2015 Chan et al, Respiratory Medicine 2013